Clearing 2026: why UK universities need recruitment intelligence
UK universities face a deficit crisis. Student Recruitment Intelligence can transform Clearing from chaos to precision.
Steven Elliott•6 Feb 2026

The reports workspace is a great place to start when using GA4, and it will allow you to answer the majority of your data questions too. The out-of-the-box reports are fine, and have their place, but pretty quickly we’d need to be able to sort, filter, compare and manipulate the data to fit our specific needs.
In this post, we’ll be going through all of the various ways we can filter and compare data in the overview reports and detail reports, including examples of common and useful lesser-known use cases.
There are three types of filters that can be performed in the reports workspace in GA4:
Being able to change the date range is almost a given in Google Analytics. However, it’s probably the most useful and common way to filter data out there.
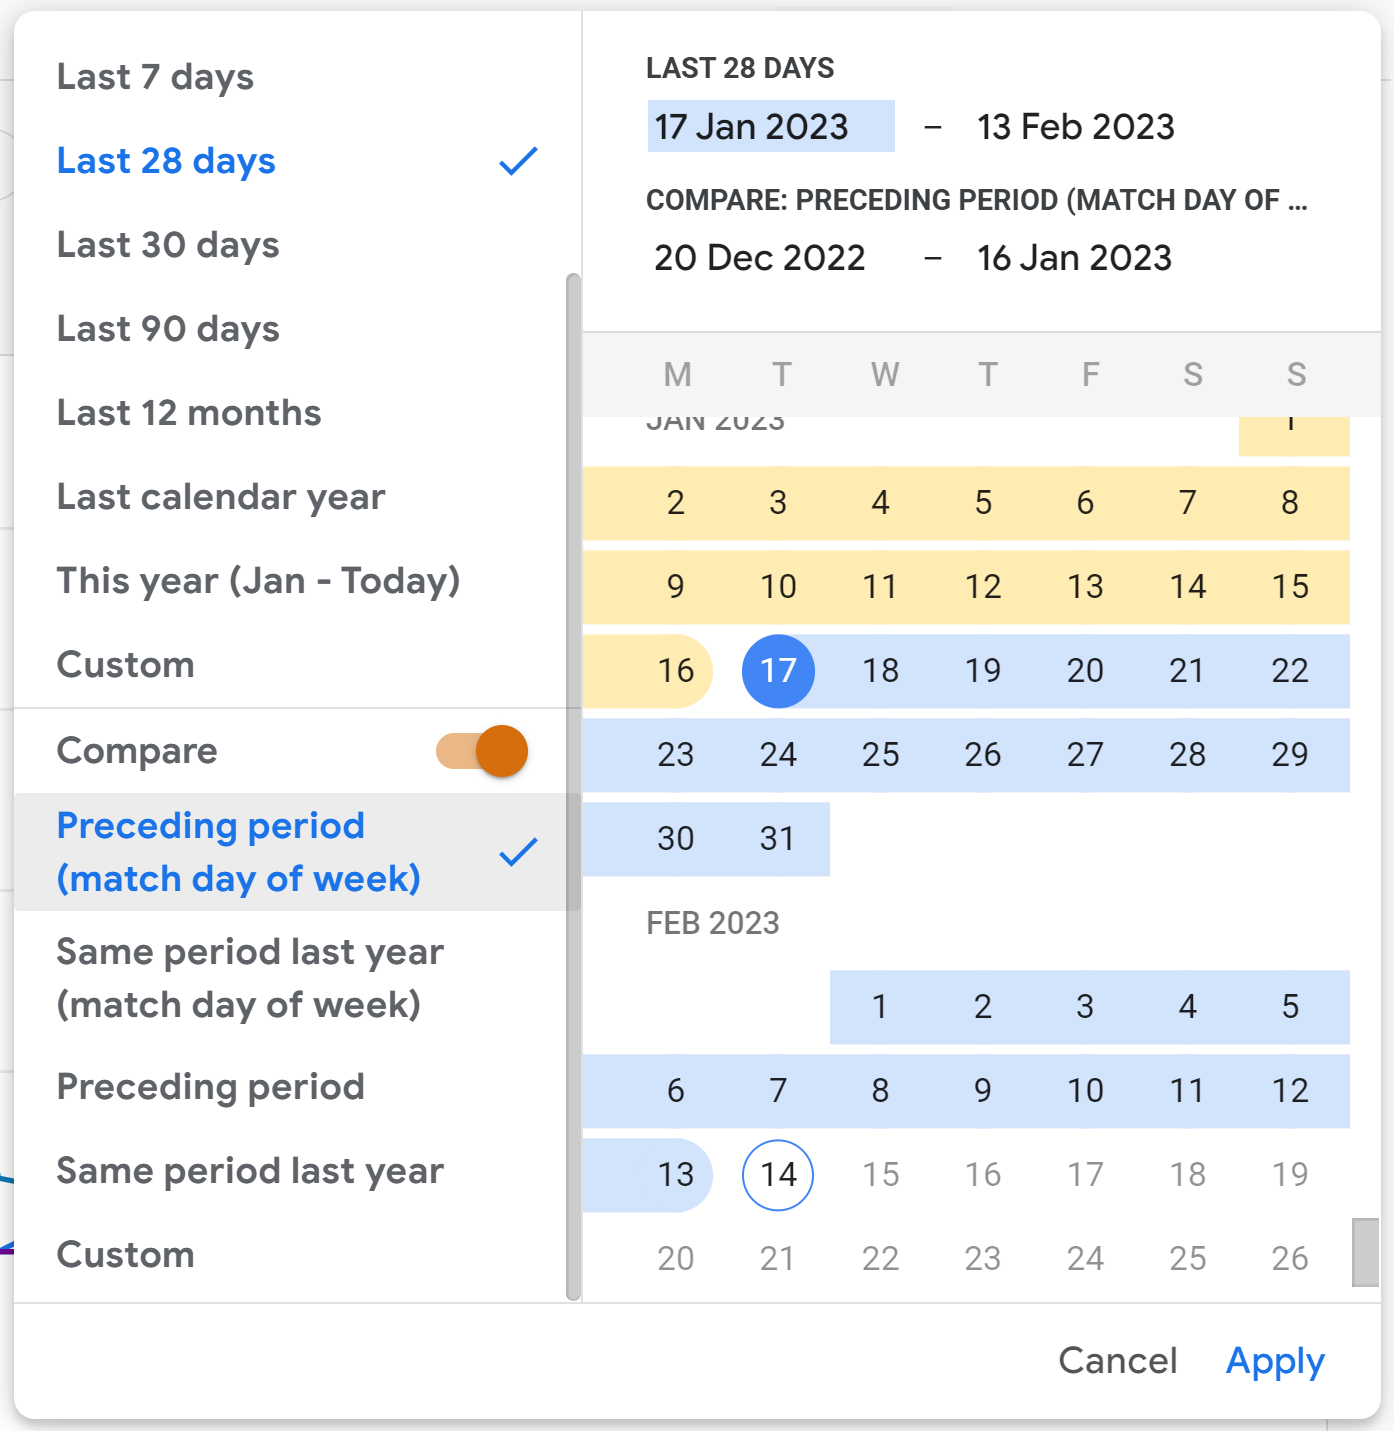
The default date range is set to the last 28 days (4 weeks), not including today. But there are plenty of very convenient pre-defined ranges for us to choose from too, including yesterday, last week (with a choice of what day the week starts on), last 12 months, and even a custom date range option to manually select a start date and end date:
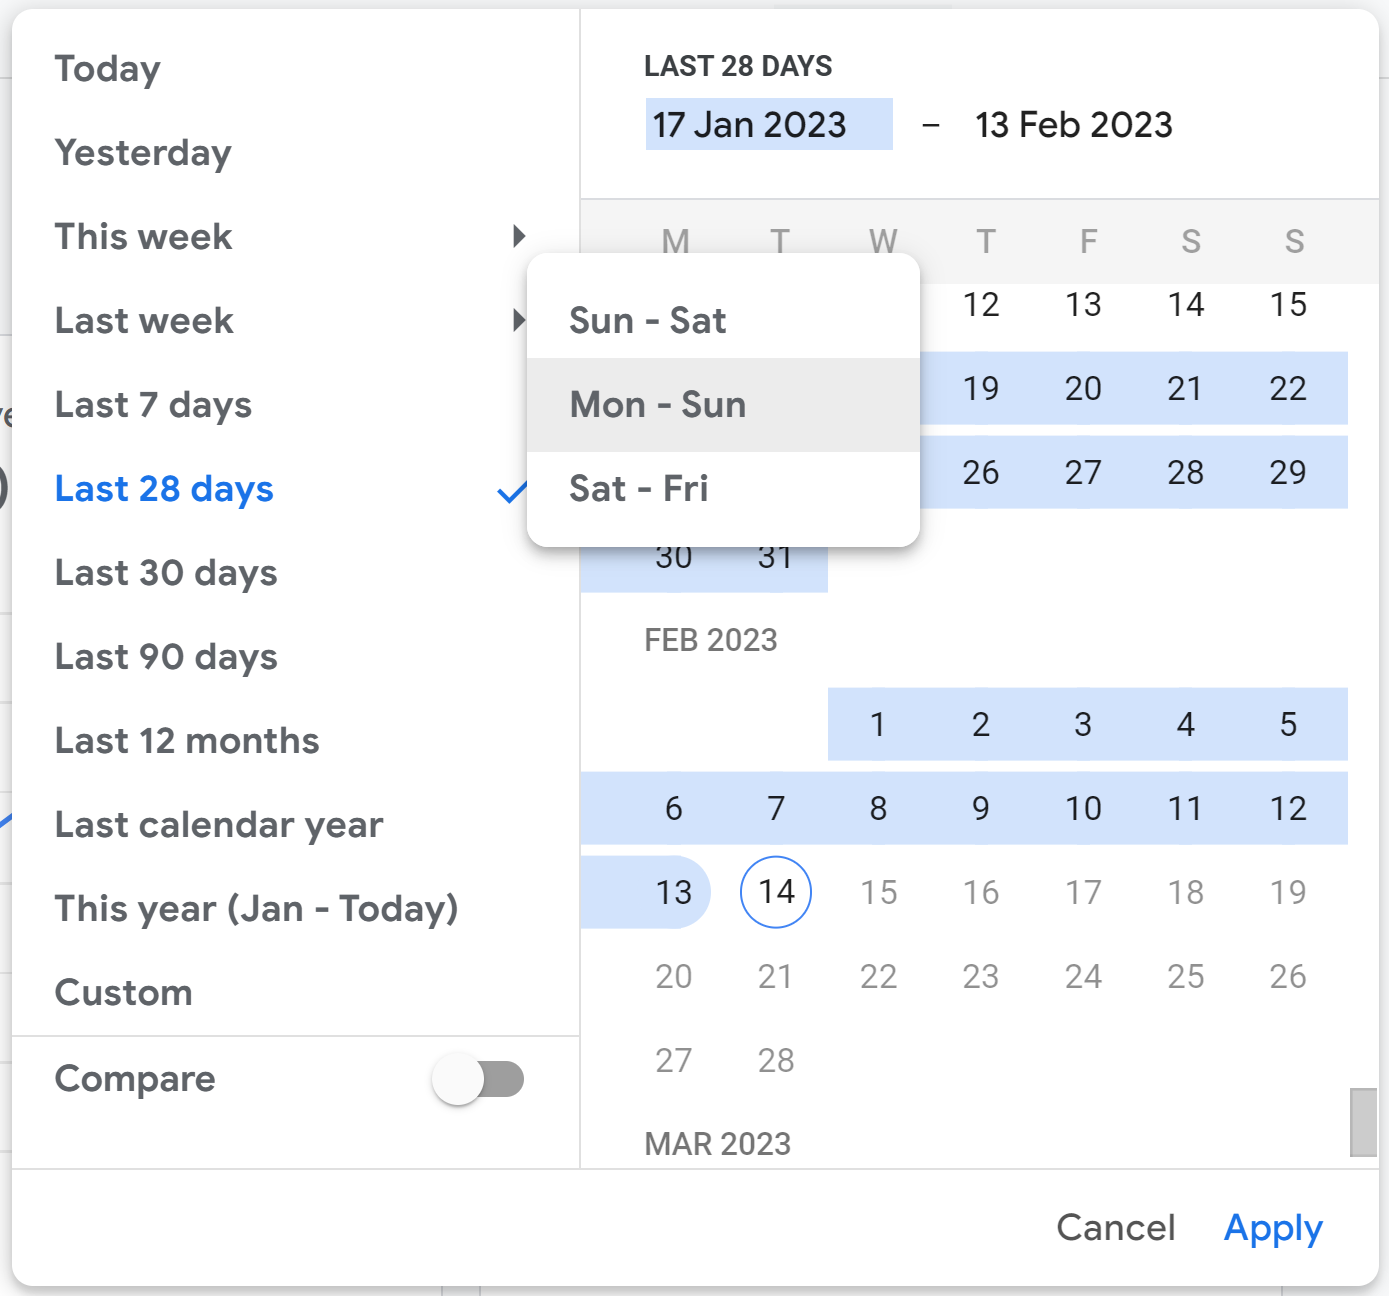
Whatever you select, the date range is ‘sticky’. That is, whatever report you navigate to, it’ll stay the same and not reset.
Table filters are a way to filter just the data table on detail reports. To add a table filter, search for a term in the search box just above and to the left of the data tale on any given detail report in GA4.
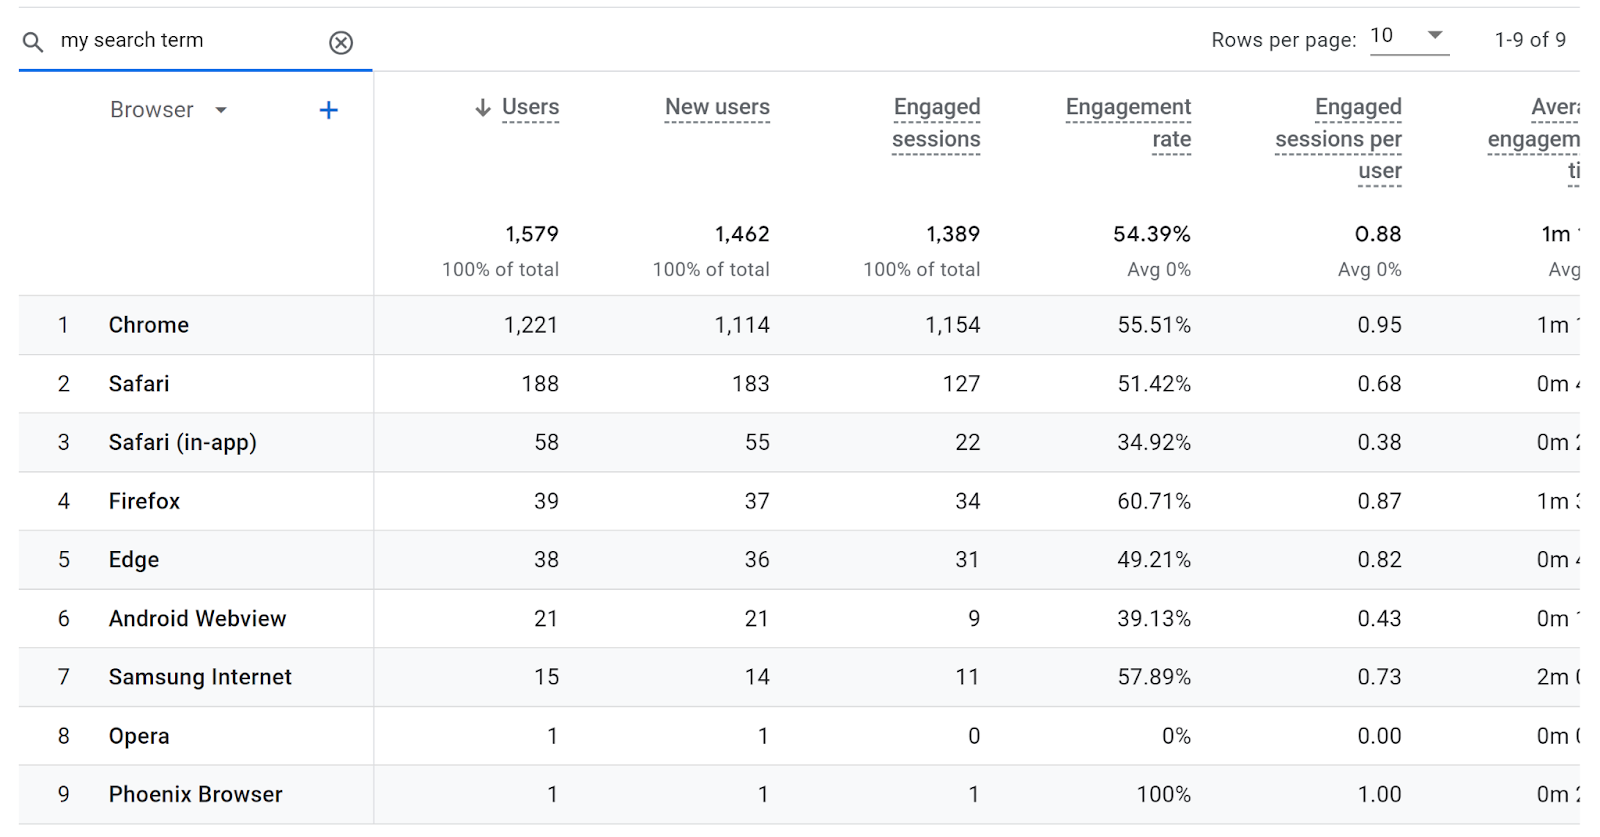
The search will be a (case insensitive) ‘contains’ match across anything in the primary and secondary dimensions in your report.
For example, in the below tech details report we have device category as a secondary dimension and then a table filter for “Desktop” applied:
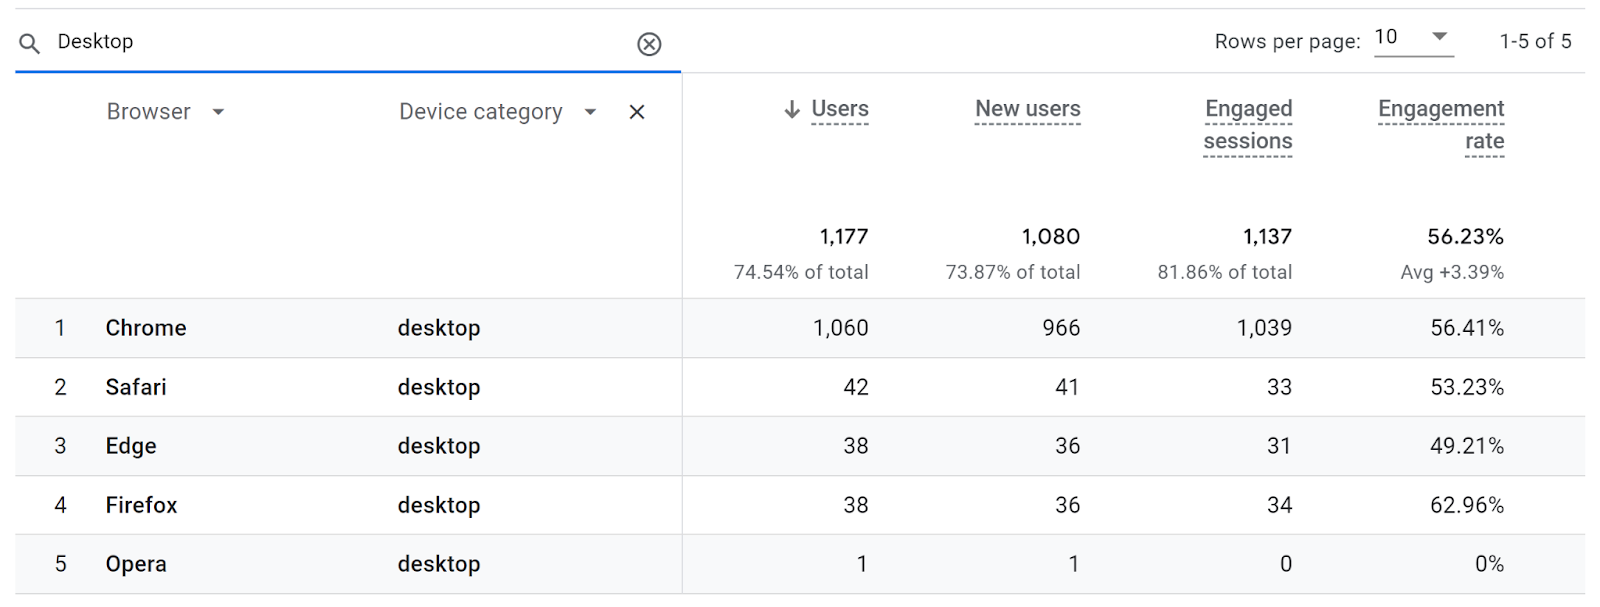
It’s worth highlighting that the header row of the data table will show a percent of total when using a table filter. So in the above example, we can see that ~75% of all users are on a desktop device in the given date range.
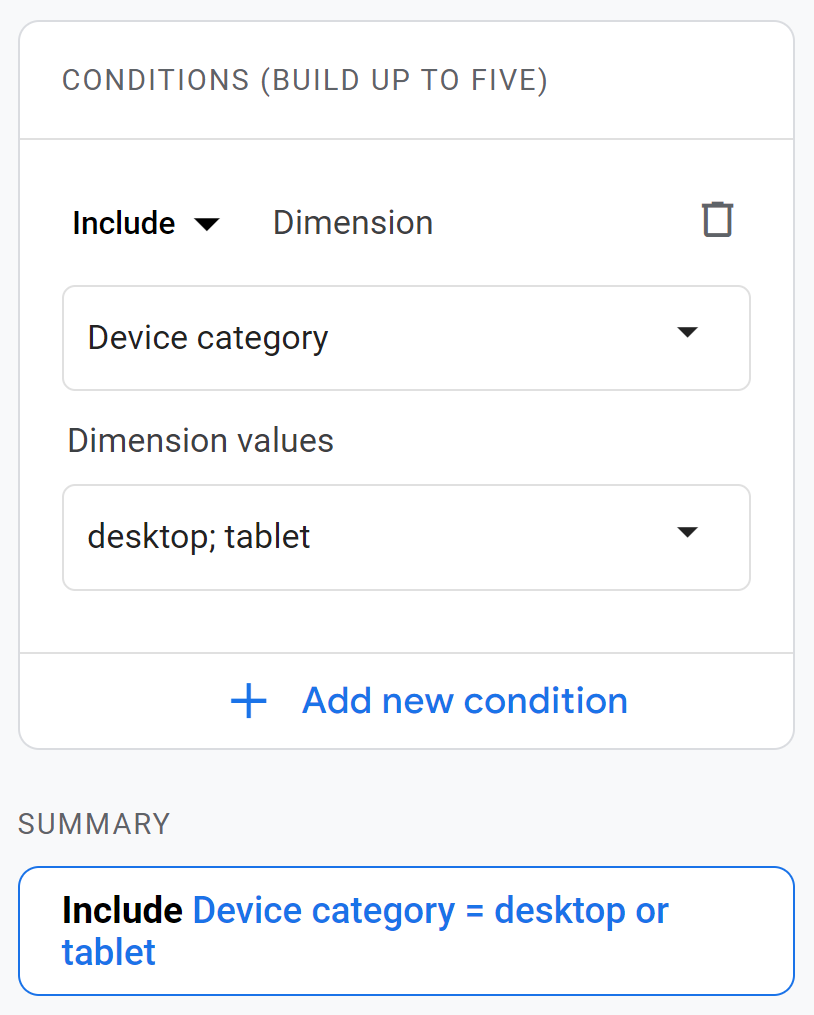
Data filters are only available in the detail reports, and can be accessed by clicking ‘Add filter’ underneath the report name at the top left of the report.
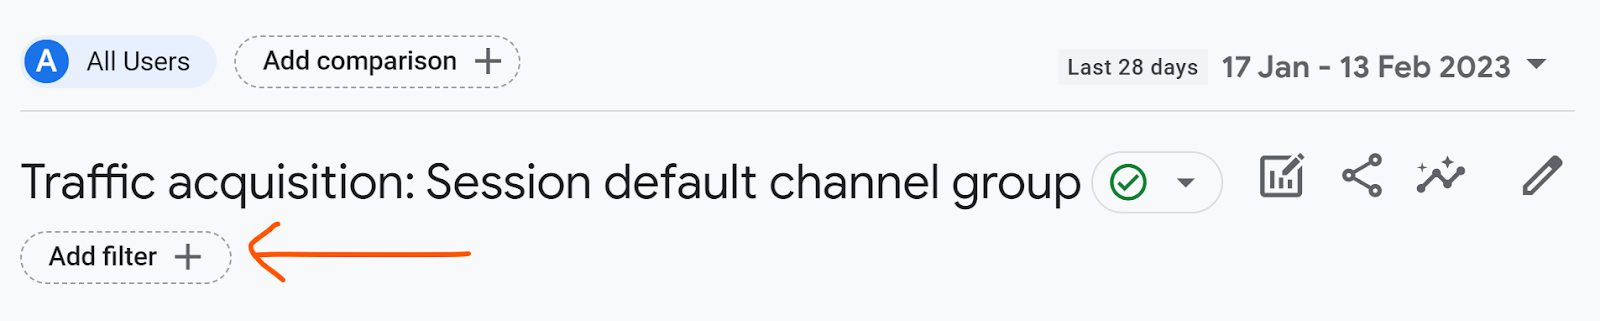
When adding a filter, you can choose whether it’s an include or exclude filter, then select a dimension from the drop-down list, and then choose the values of that dimension from the second drop-down list. A summary of the filter is provided below to double-check that it’ll do what you want it to. For example:
There are two ways to compare data in the reports workspace in GA4:
Comparing date ranges may also feel a bit obvious, or even assumed of any data tool nowadays, but it’s still a powerful way to quickly and easily see how things have changed over time. There are a number of options to choose when comparing date ranges - previous period, last year and even a manually selected range of your choosing:
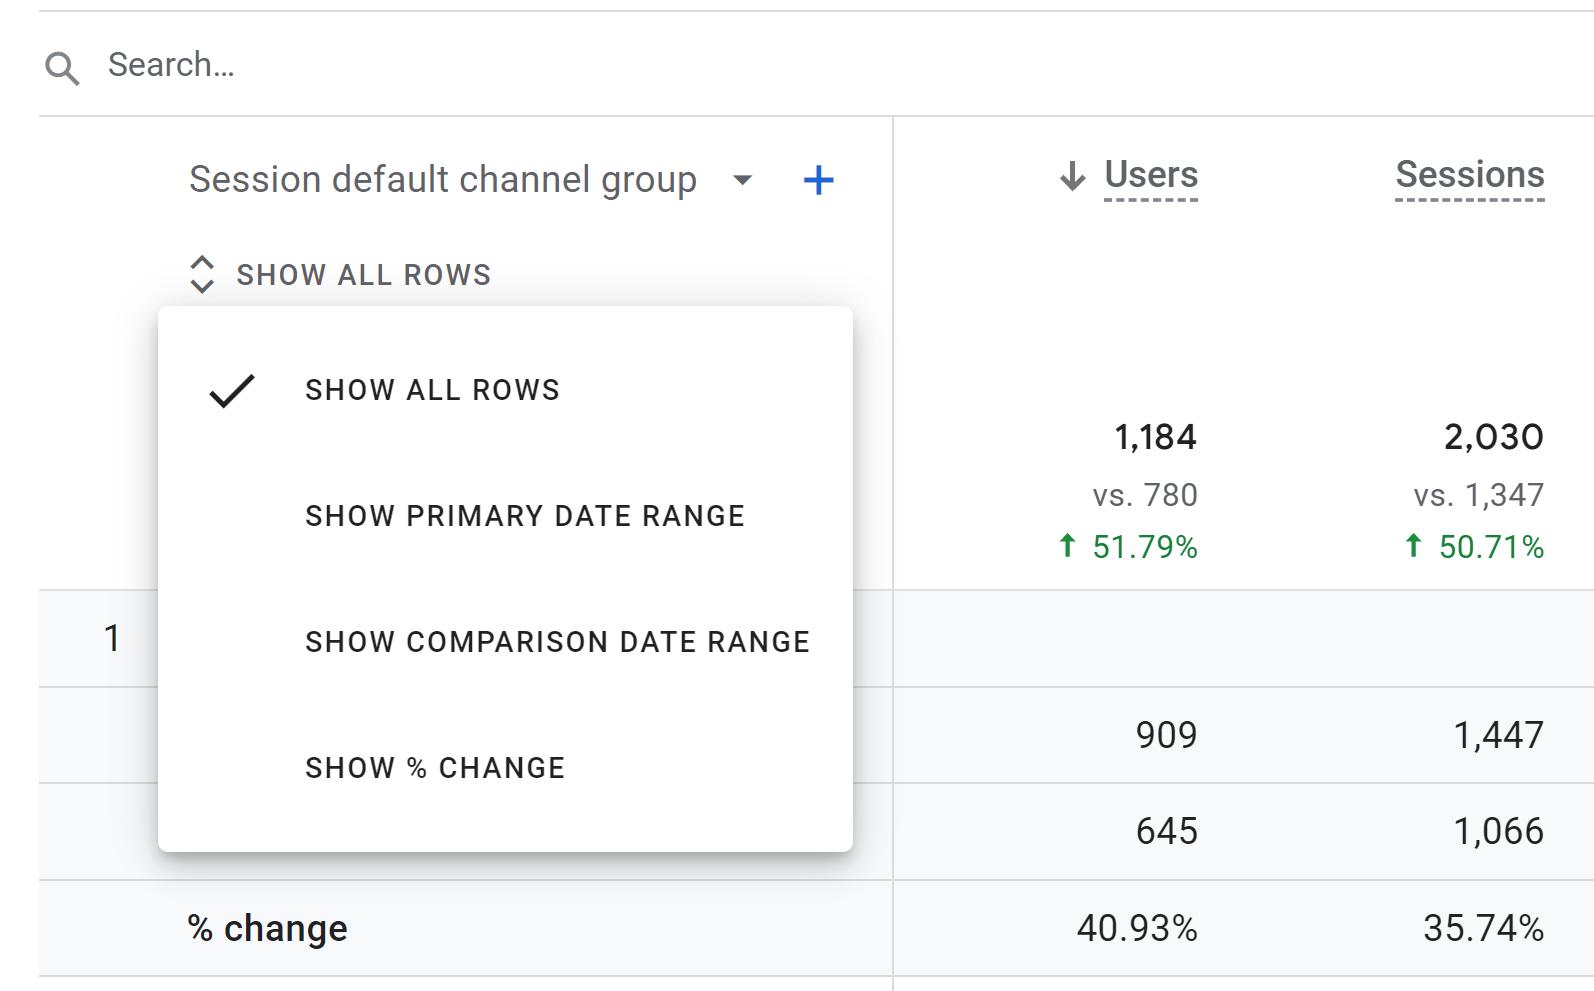
By comparing any date range in a detail report, each row of the table is now three - the primary date period, the comparison date period and then the percent change. This can make the data a tad busy and potentially unreadable, but luckily there’s an option to hide/show the additional rows at the top of the primary dimension, just below the dimension name:
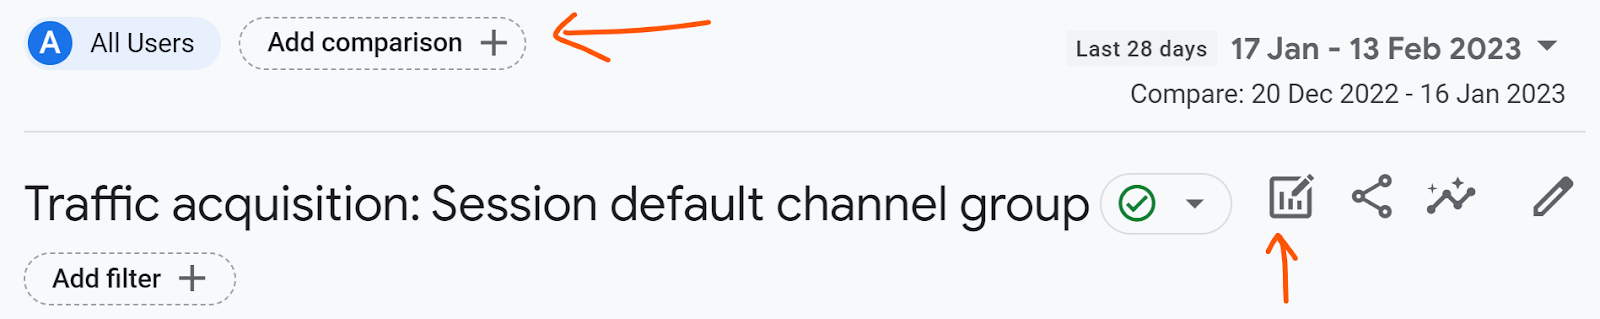
Comparisons are a generic name given to data comparisons, where you can duplicate the data in any report, but filtered differently to compare against. You can add and edit comparisons at the top of a report by clicking ‘Add comparison’ or clicking the edit comparisons icon:
The process of adding a comparison is exactly the same as adding in a data filter, and you can add up to five at any one time.
A good use case for data comparison is if you have Android/iOS apps tracking alongside a website, where we can see the various platform data side-by-side. To see this, we’d set up an ‘include’ comparison for each platform we have tracking. For example, for iOS we’d have:
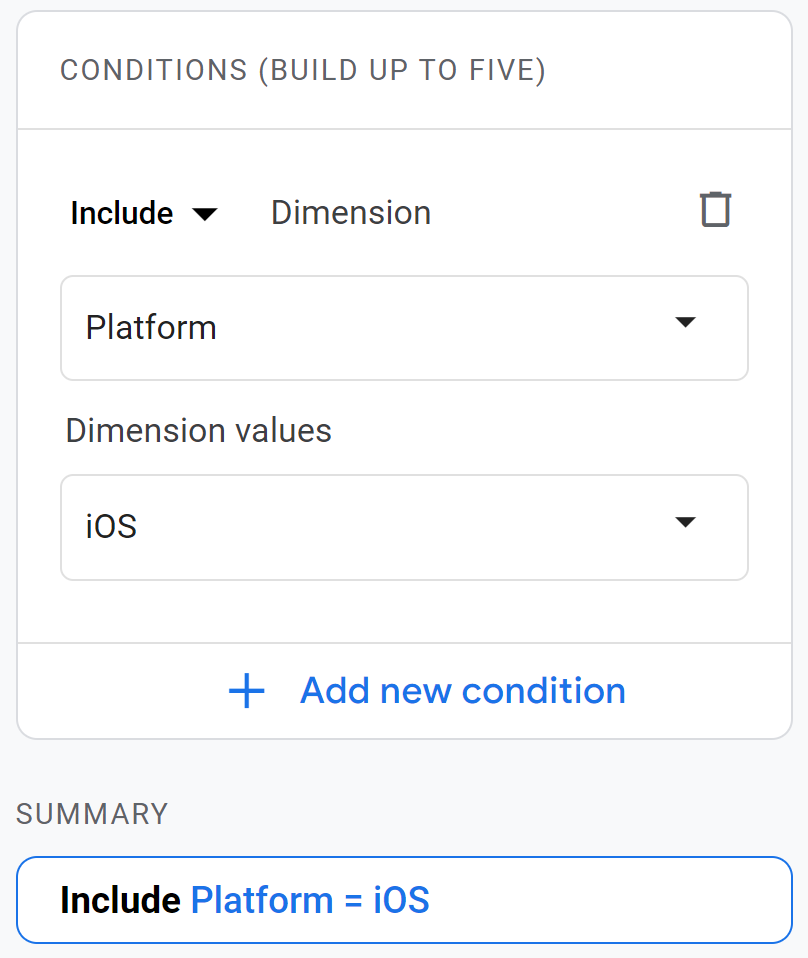
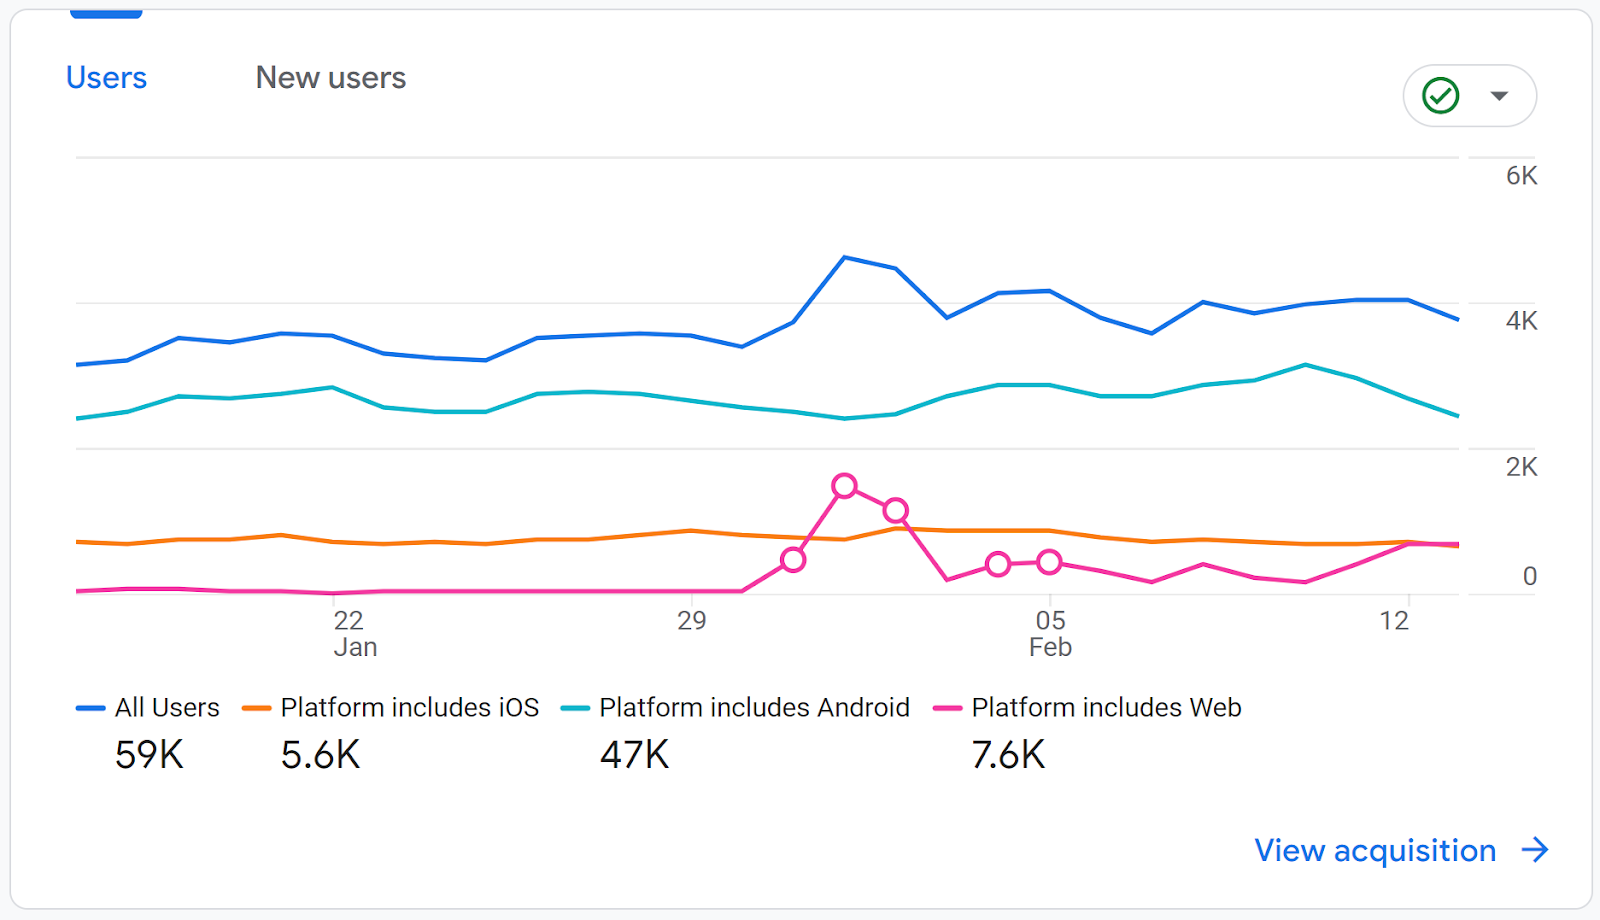
ANd then setting one up for web, iOS and Android would easily and quickly break down any chart and table:
Each of these filters and comparisons can be useful when using them correctly - and even more so when combining them together in a single report. Not all of these are available in all types of reports, so the table below details what can be used where:
| Filter/comparison | Works in overview reports | Works in detail reports |
|---|---|---|
| Date range filter | YES | YES |
| Table filter | NO | YES |
| Data filter | NO | YES |
| Date range comparison | YES | YES |
| Data comparison | YES | YES |
UK universities face a deficit crisis. Student Recruitment Intelligence can transform Clearing from chaos to precision.
At the start of the year, if you’d asked us whether Measurelab would be standing shoulder to shoulder with Europe’s biggest consultancies by September, we would've been surprised. Not because we don't believe in ourselves, but because these things feel so distant - until suddenly, they’re not. So, here it is: we’ve been awarded the Marketing Analytics Services Partner Specialisation in Google Cloud Partner Advantage. What’s the big deal? In Google’s own words (with the obligatory Zs): “Spec
BigQuery just got a major upgrade, you can now plug directly into Vertex AI using the new AI.GENERATE function. Translation: your analytics data and generative AI are now best friends, and they’re hanging out right inside SQL. That opens up a whole world of new analysis options for GA4 data, but it also raises some questions: * How do you actually set it up? * What’s it good for (and when should you avoid it)? * Why would you batch the query? Let’s walk through it step by step. Step 1: H