Uncategorized
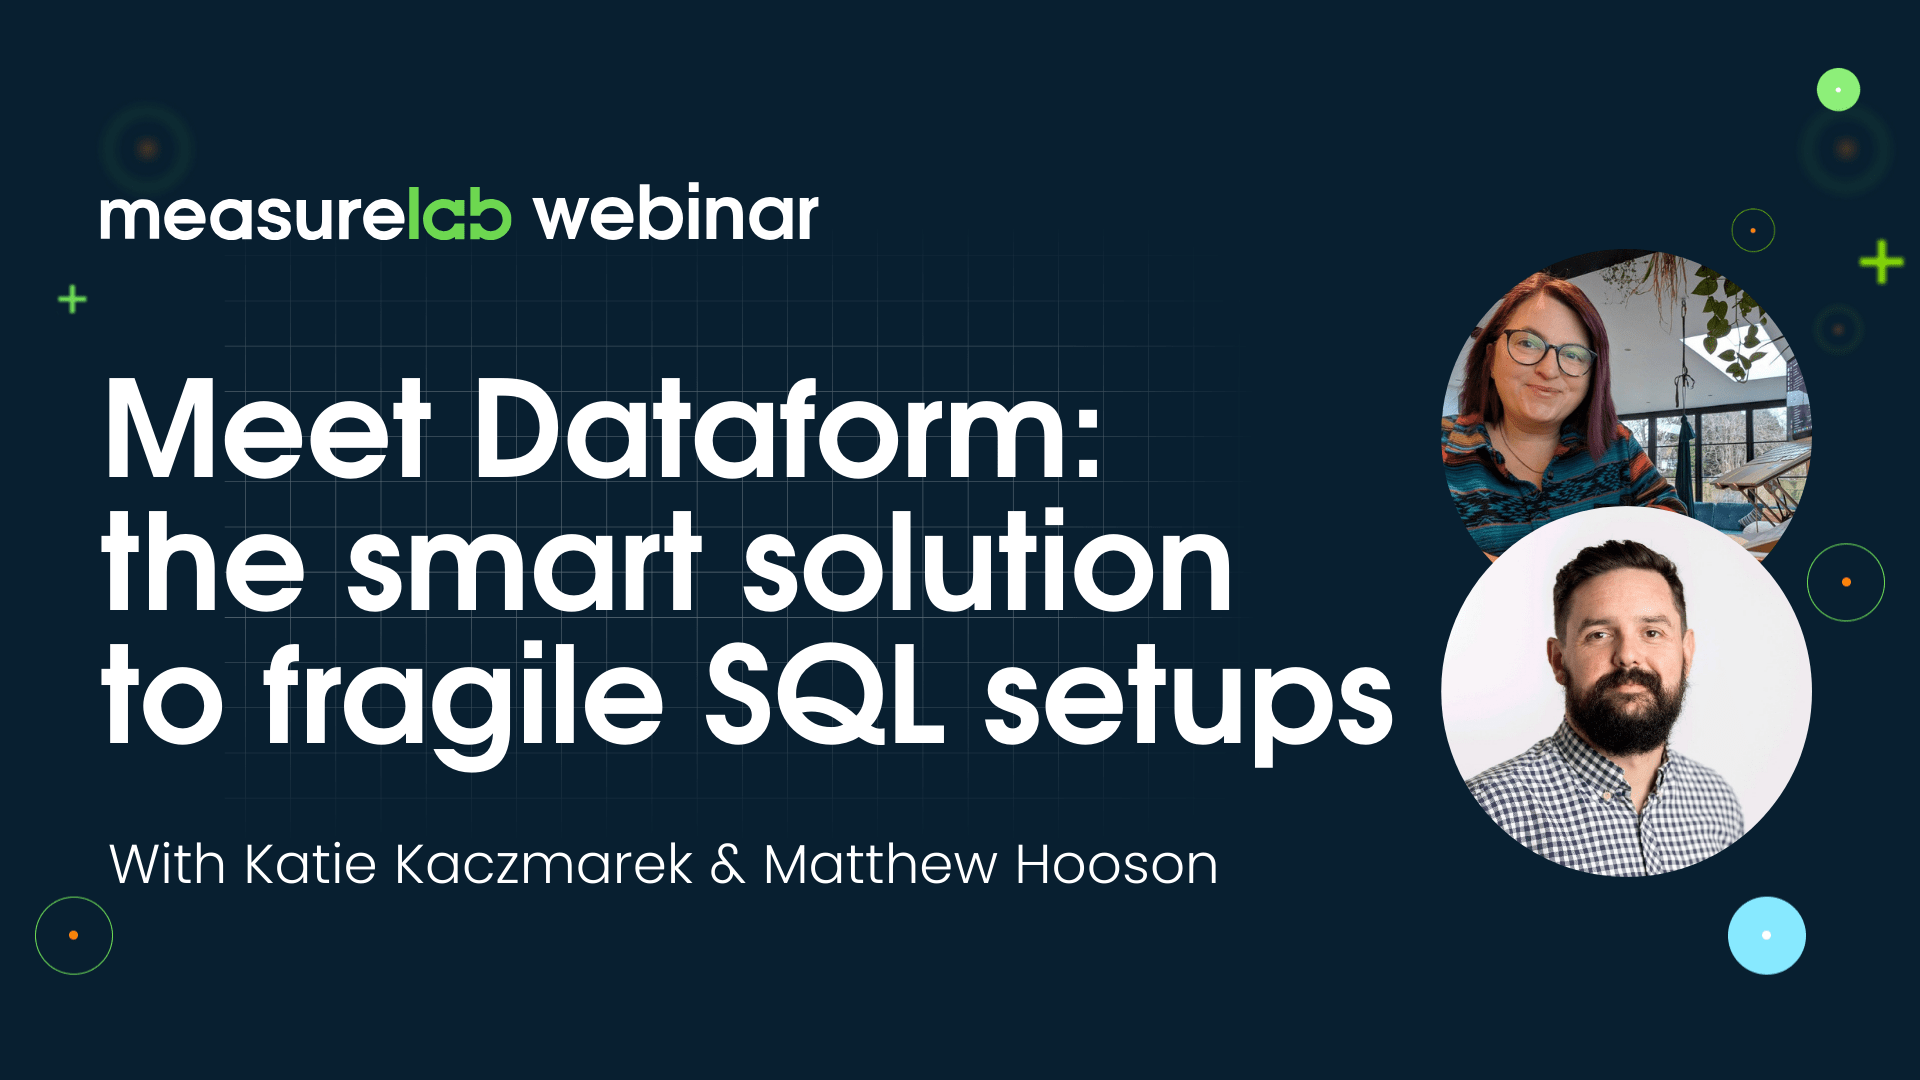
Webinar: Meet Dataform, the smart solution to fragile SQL setups
In this 30-minute webinar, learn how to bring structure and sanity to your SQL workflows, without adding complexity. We cover…
Measurelab awarded Google Cloud Marketing Analytics Specialisation
At the start of the year, if you’d asked us whether Measurelab would be standing shoulder to shoulder with Europe’s…

Webinar: Stop the martech madness! Go composable. Deliver value faster.
In this 30-minute webinar, we use three real-world examples to demonstrate how a composable approach can help you do more…
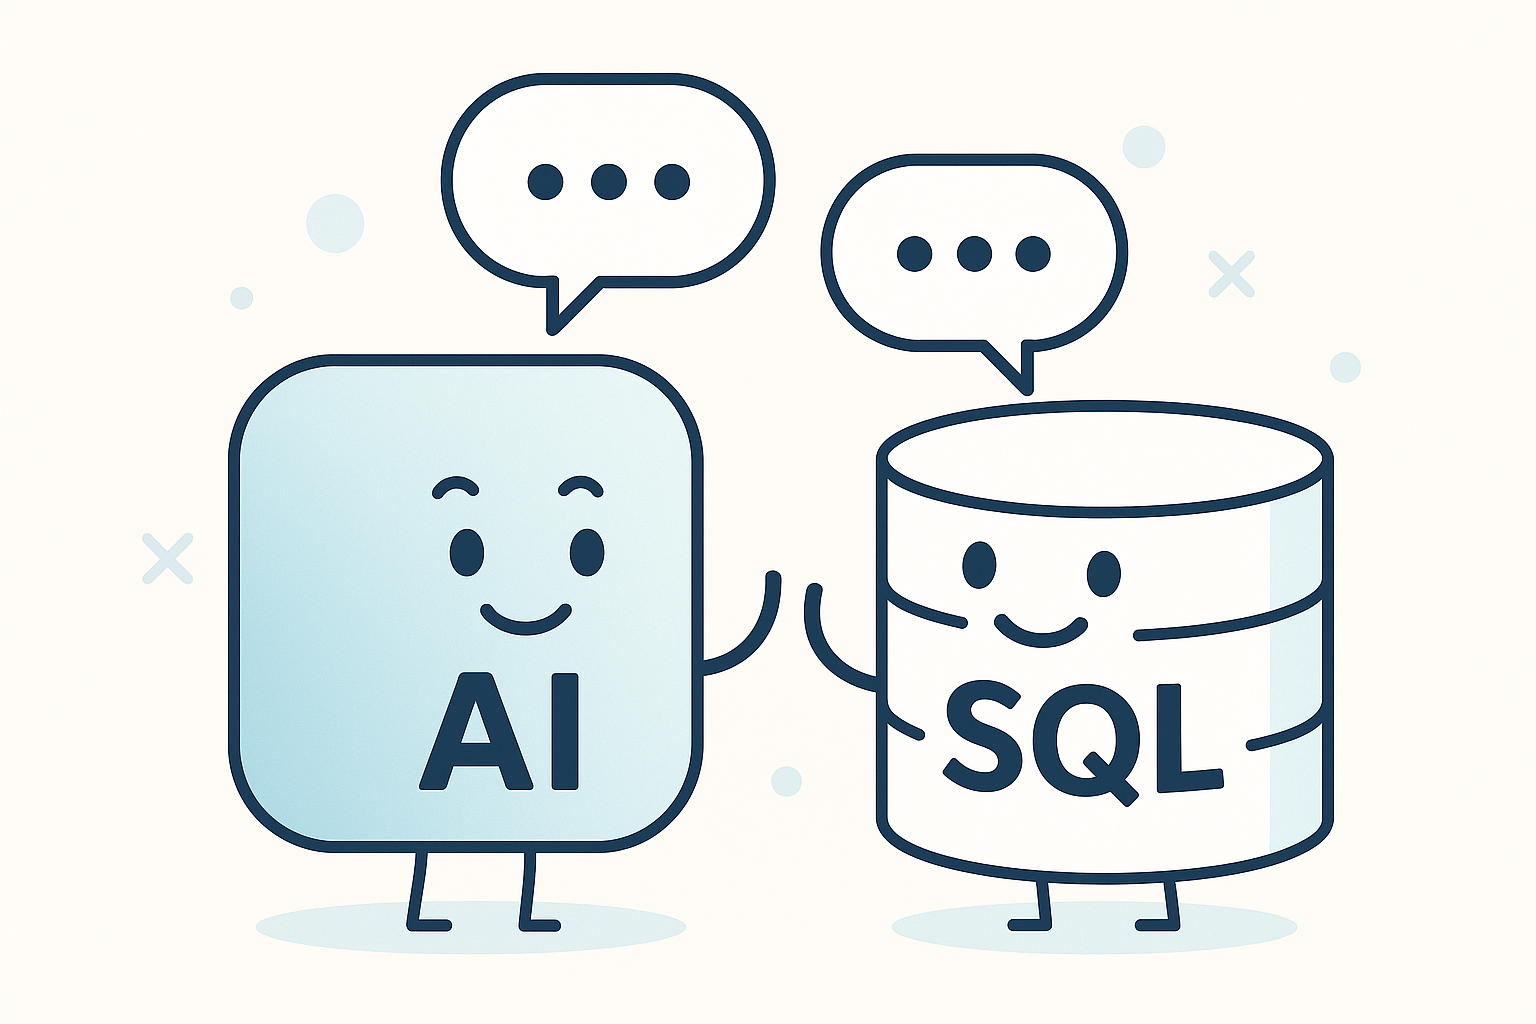
BigQuery AI.GENERATE tutorial: turn SQL queries into AI-powered insights
BigQuery just got a major upgrade, you can now plug directly into Vertex AI using the new AI.GENERATE function. Translation:…

How to start forecasting in BigQuery with zero training
If you’d told me five years ago that I’d be forecasting product demand using a model trained on 100 billion…

Easy ways to prepare your BigQuery warehouse for AI
You’ve probably heard that AI is coming to make our lives easier, especially in tools like BigQuery. But here’s the…
Data pipeline optimisation with Google Cloud and Dataform
In our recent engagement with a client, we went on a journey to transform their data pipelines, tackling inefficiencies in…

Dataform for BigQuery: A basic end-to-end guide
Dataform is a powerful tool for managing your data workflows in a structured, version-controlled, and automated way. Whether you're a…
How to extract GA4's event sequencing in BigQuery using the new batch fields
Google Analytics 4 (GA4) exports event data to BigQuery, enabling detailed user behavior analysis. However, GA4 batches events before sending…

Automating BigQuery workflows with conditional logic and data readiness checks
BigQuery offers powerful scripting capabilities that can simplify complex workflows. In this post, we’ll explore two essential techniques: using IF...THEN...END…