Clearing 2026: why UK universities need recruitment intelligence
UK universities face a deficit crisis. Student Recruitment Intelligence can transform Clearing from chaos to precision.
Steven Elliott•6 Feb 2026

How often have you run your code in BigQuery only to find a bit of data missing that you KNOW should be there? You need to debug your SQL to find where the error has occurred and at what point your code dropped that data. Because if you can find the error for that bit of code you’ll be able to fix the code for all the data.
With the new world of GA4 more of us are getting on board with BigQuery, with little to no experience of SQL. So lots of us are turning to websites like ga4sql and AI to create code for us. Which is fine if it works, and more importantly, gives us the correct data! When it doesn't you need to debug your SQL and be able to step through your code and run the elements individually looking for the data that is missing or incorrect.
Usually we would find errors during one of the many checks you should do with your data. For instance, if you know there should be a 1000 users for a specific day and your final table only gives you 980 then where did the 20 go. We could extract the 1000 users and cross reference with the final data to see the id of the 20 users that didn't get extracted. Let's pretend for this example we found a user with the id 1234 on 10/08/2021 which did not appear in our data.
Before we do anything else you must have a think about the amount of bytes used to run the code, we are going to step through the code which means we are going to run individual elements at a time, each run will cost money in BigQuery. So before we begin, limit the code to that individual bit of data that you want to hunt for, could be an id and a date range (date range is especially important if that is what the table is partitioned by). In this instance we will limit the date to 10/08/2021 and the user to 1234.
Lots of code has multiple CTE’s (Common table expressions) . CTE’s are all the WITH statements that happen prior to your final code running, that help you break up a complex query into more digestible bits. These are, in their simplest forms, just temporary tables to store information that you will want to use in your final bit of code. Each CTE will perform a task to retrieve an element of data that you want.
Lets begin to debug your SQL. The best way to start is with the very first CTE and see if the data you are looking for is even in the first element of the code.
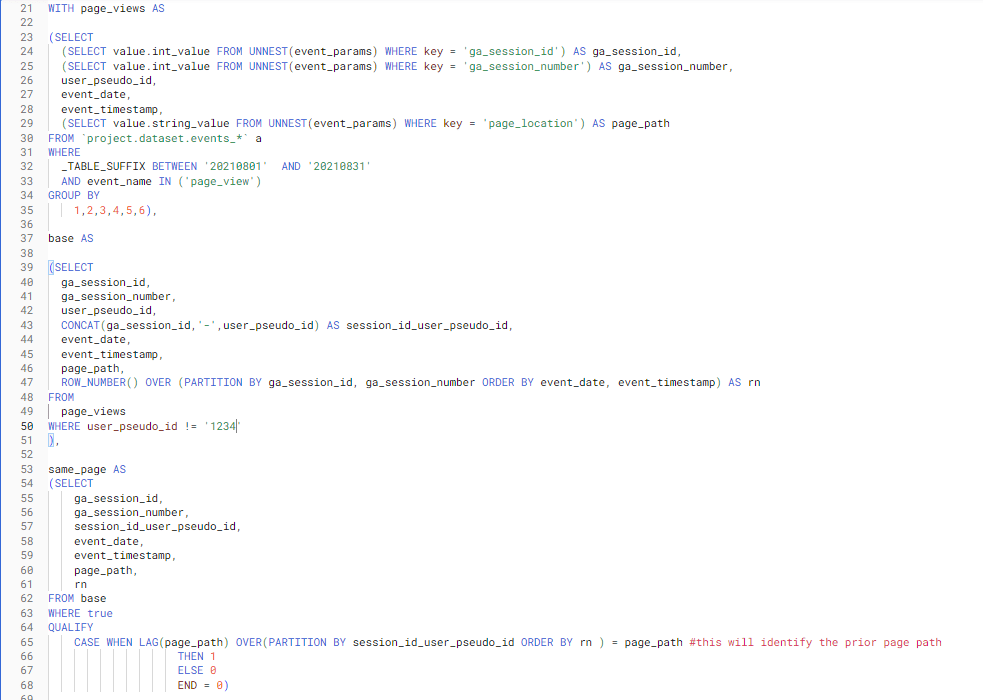
This is what CTE’s look like. So we can see here that there are 3 CTE’s named page_views, base and same_page:
So we need to unpick at what point in our code the user 1234 is dropping off (in this code it is extremely obvious, but lets pretend it's not!).
Did you know that in BigQuery you can simply highlight the code you want to run and BigQuery will only run the highlighted code, this makes it a lot easier to run segments of the code and dissect where issues arise.
We build intelligence platforms on BigQuery, Dataform and Google Cloud — from setup to ongoing optimisation.
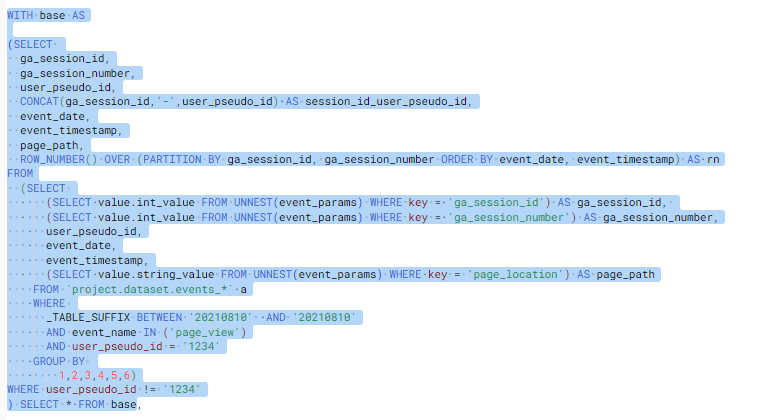
The first thing we should do is limit our first CTE to confirm if the user exists in the first extract. So what we need to do is add some additional information to the first CTE and then run that segment. We will limit the date to the date we know that the user appeared and limit the users to just the user we want to look for. Like this:
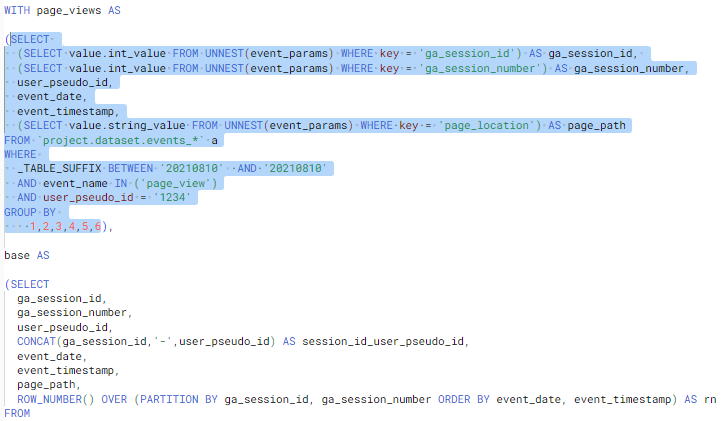
In this code we can see that each CTE feeds off the previous one so any data limited in the first CTE will filter through to all the others. If we had sections of code referencing other tables we might need to add code to limit that data also. So when we move on to the next CTE we do not need to add any code to limit the data we can just run it. However we will need to do some additional tweaking so that we can highlight and run the code as it is no longer a stand alone code, we need to include the previous code also. To do this we can add a simple SELECT * statement after the 2nd CTE and this will return all the data for the second CTE (its important to make sure that the select * is placed before the comma).
Please remember that SELECT * should only be used when we are sure it is not going to run large bytes of data. We know it is good in this example as we have already limited our data to a date and a user.
Like this:
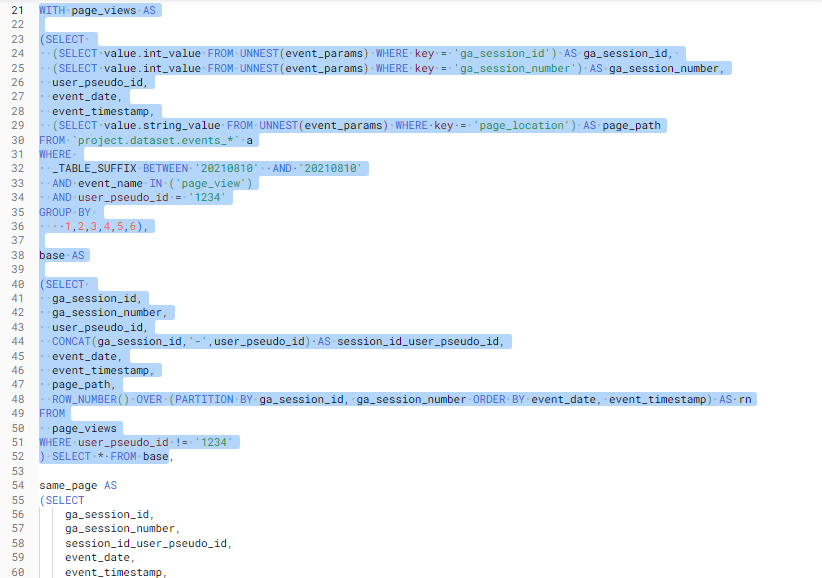
After running this code I can see that the data for 1234 is no longer there so the error appears to be happening in this section of code…hopefully you can all see why? We have applied a WHERE statement in the second CTE to exclude 1234. If we remove this the data will be in our final table.
Other things you might want to look out for is Subqueries, these work in exactly the same way as a CTE but the table is nested in another query. So the same code as above could look like this:
When you see this you can do two things, extract the subquery code out and create a CTE (this is much tidier). Or you can extract the subquery to a new query and run it step by step there and leave the original code as it is.
Another really useful way to debug your SQL by querying sections of your data is by utilising the temporary table that is created when you run code. Part of the query results includes job information, towards the bottom of these details is a destination table. If you click this temporary table you can query the data like you would any other table. It's really handy to review data before creating a final table. But be warned these temporary tables have a life expectancy of 24 hours so they are only really useful for quick reviewing whilst debugging your SQL.

That was an extremely easy unpicking, but hopefully it has given you the tools to step through your code one segment at a time and find where errors have occurred. Even if you do not have an error, running code step by step will give you a deeper understanding of what each section of the code is doing and will enable you to debug your SQL easier. Happy querying everyone.
For help with your next steps with SQL check out my other blog where you can find ids and suggestions on how to review your SQL. Or how to reduce your BigQuery cost where you can find hints and tips on how to reduce query costs.
We build intelligence platforms on BigQuery, Dataform and Google Cloud — from setup to ongoing optimisation.
Take our short assessment to find out where your data stack stands and what to prioritise next.
UK universities face a deficit crisis. Student Recruitment Intelligence can transform Clearing from chaos to precision.
In this 30-minute session, we unpacked what we had been experimenting with using Google’s conversational AI to spend less time wrangling data and more time actually learning from it.
Dara and Matthew recap 2025 with 12 top highlights, AI, analytics, and the best moments on The Measure Pod.