Customising GA4’s reports menu using the report library

By now you’ll all have GA4 up and running (I hope!) but now the realisation is kicking in that you have to actually start using the UI and I don’t know about you all but for me, it didn’t quite feel right. Let’s talk about the UI, where the hell did all my reports go?!
I miss Universal Analytics UI! There I said it.
GA4 is fantastic and I love some of the new features they have brought out like creating and modifying events from within the UI and the additional layer of user acquisition; however I miss the familiarity of the Universal Analytics UI. It feels like I’m staying in an AirBnB. Yes they may have the log fire I’ve always wanted and a kitchen I dream about, but whenever I go to cook something I have to open every cupboard to find the utensils and pots I need. It’s all there I just don’t know where.
This got me thinking, using the Reports Library feature, could I rebuild UA in GA4? Could I get my dream kitchen and log fire and know where everything is!?
Before we jump in, let me first explain what the reports library is. It’s a new feature within GA4 that allows editors and administrators to customise the Reports workspace. Essentially you can create, customise and add premade filters to any report in your property, meaning we can change the UI!
How to create a new report
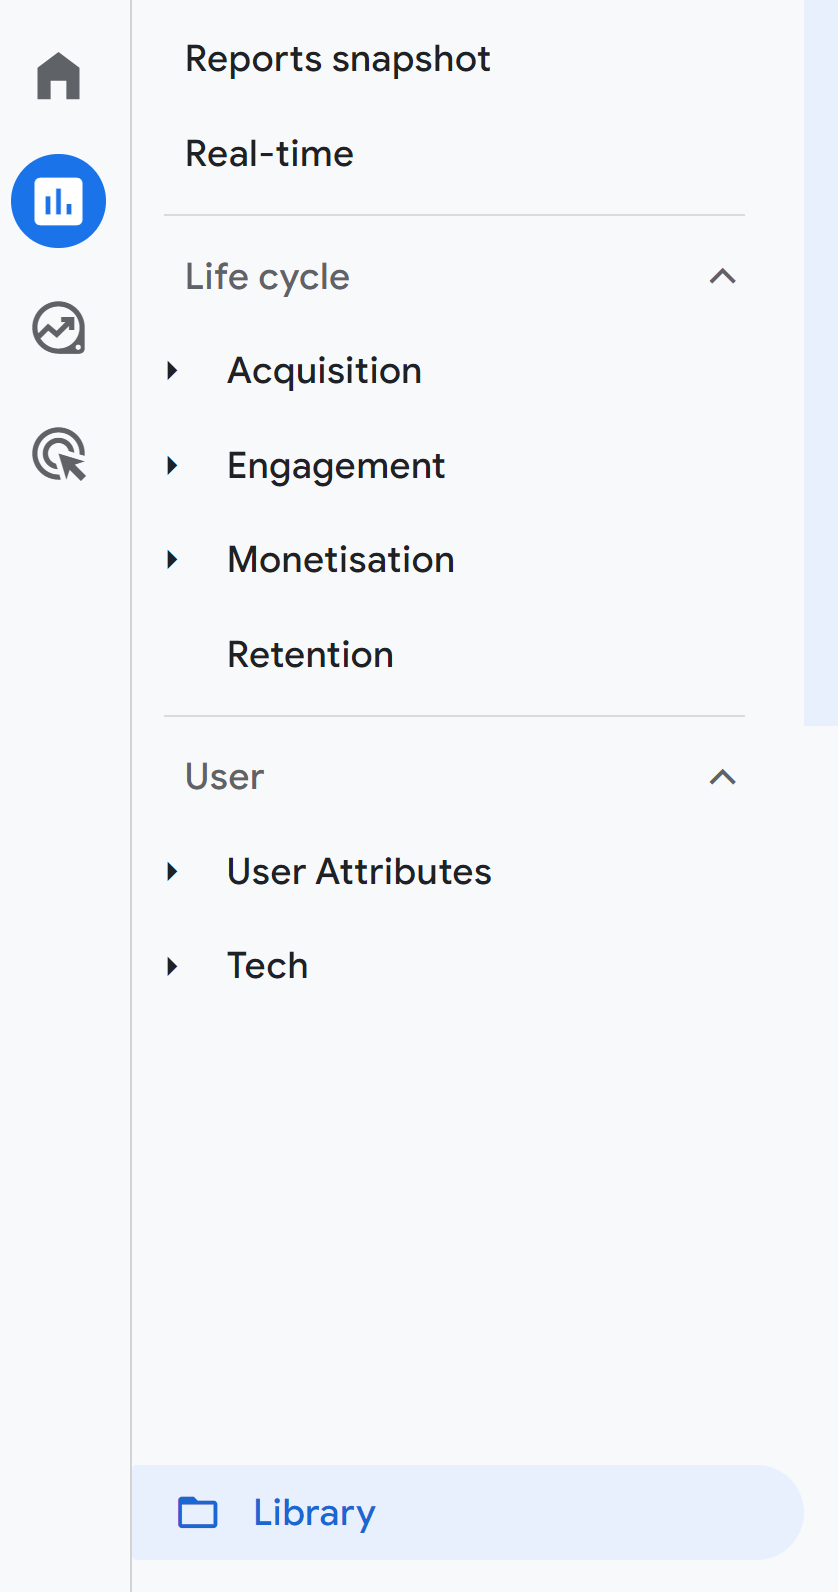
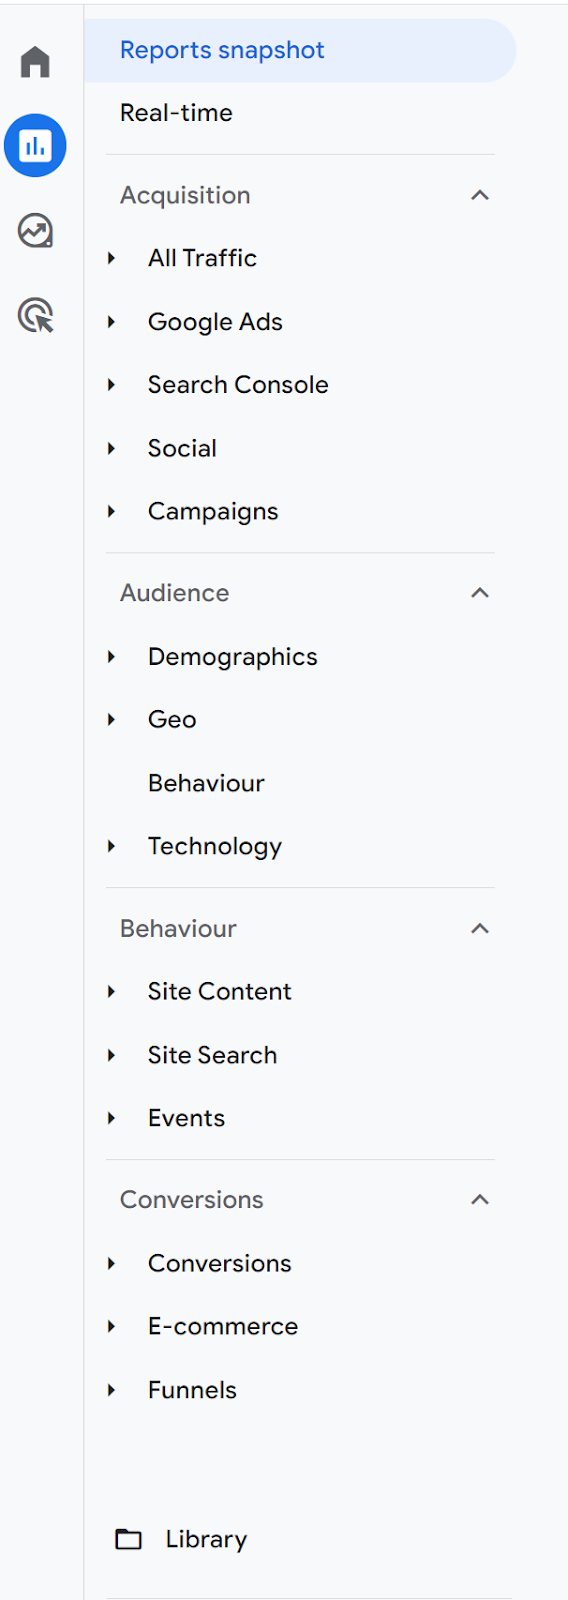
In the reports workspace, head to the ‘Library’ which is at the bottom of the menu:
Now in the ‘Library’, you can either edit an existing collection, create a new collection or create a new report.
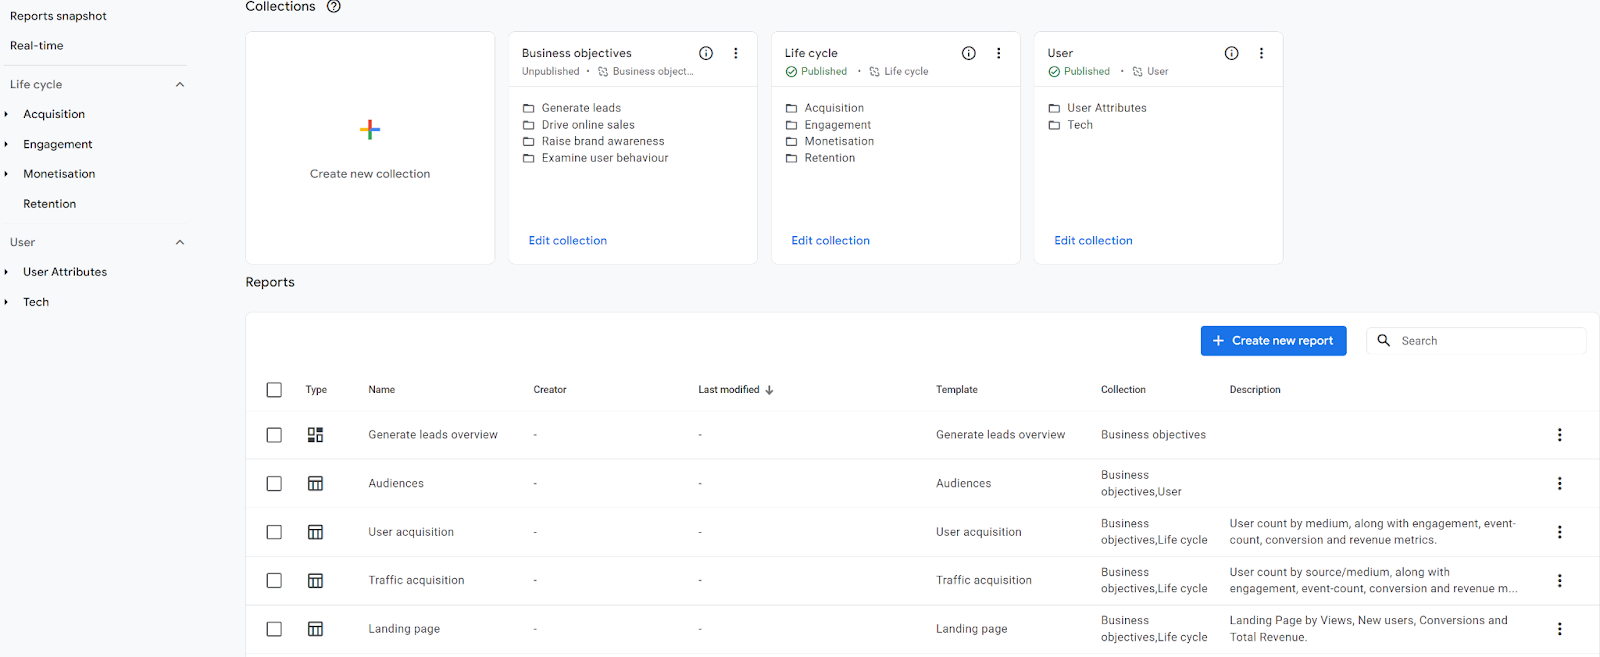
We’re going to jump in and create a new report that we can add to the existing ‘Life-cycle’ collection. So click on the ‘+ Create new report’ button. You’ll then see two options to either create a detailed or overview report.

A detailed report is like you see on the ‘Traffic acquisition’ report – it’s one page with two graphs at the top and then a table at the bottom.
An overview report is like on the ‘Acquisition – Overview’ report – it’s meant as a summary / landing page with links off to more detailed reports.
For now we’re going to create a detailed report – we can choose to create a report from a template or to start from scratch. For ease, let’s use the Traffic acquisition report as our template.
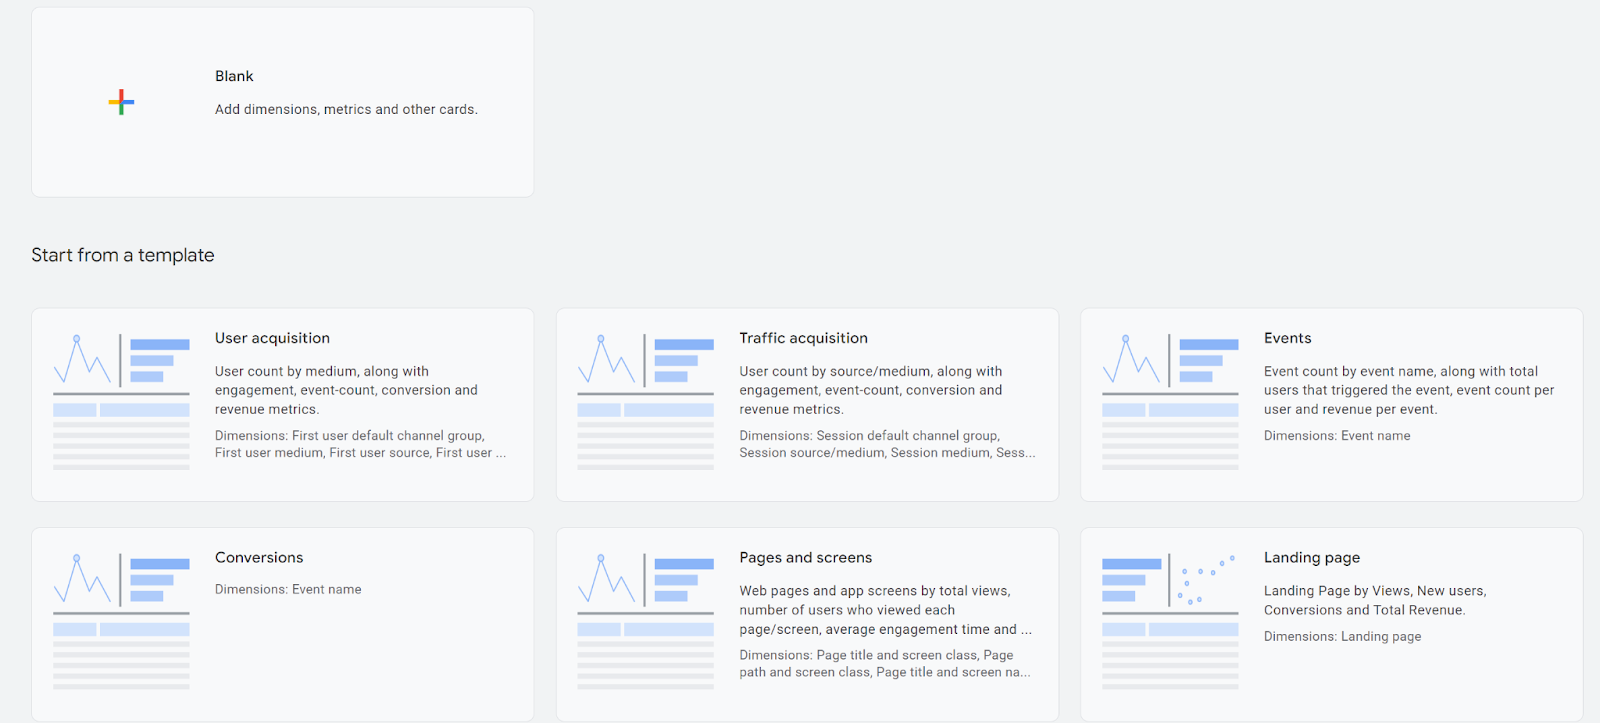
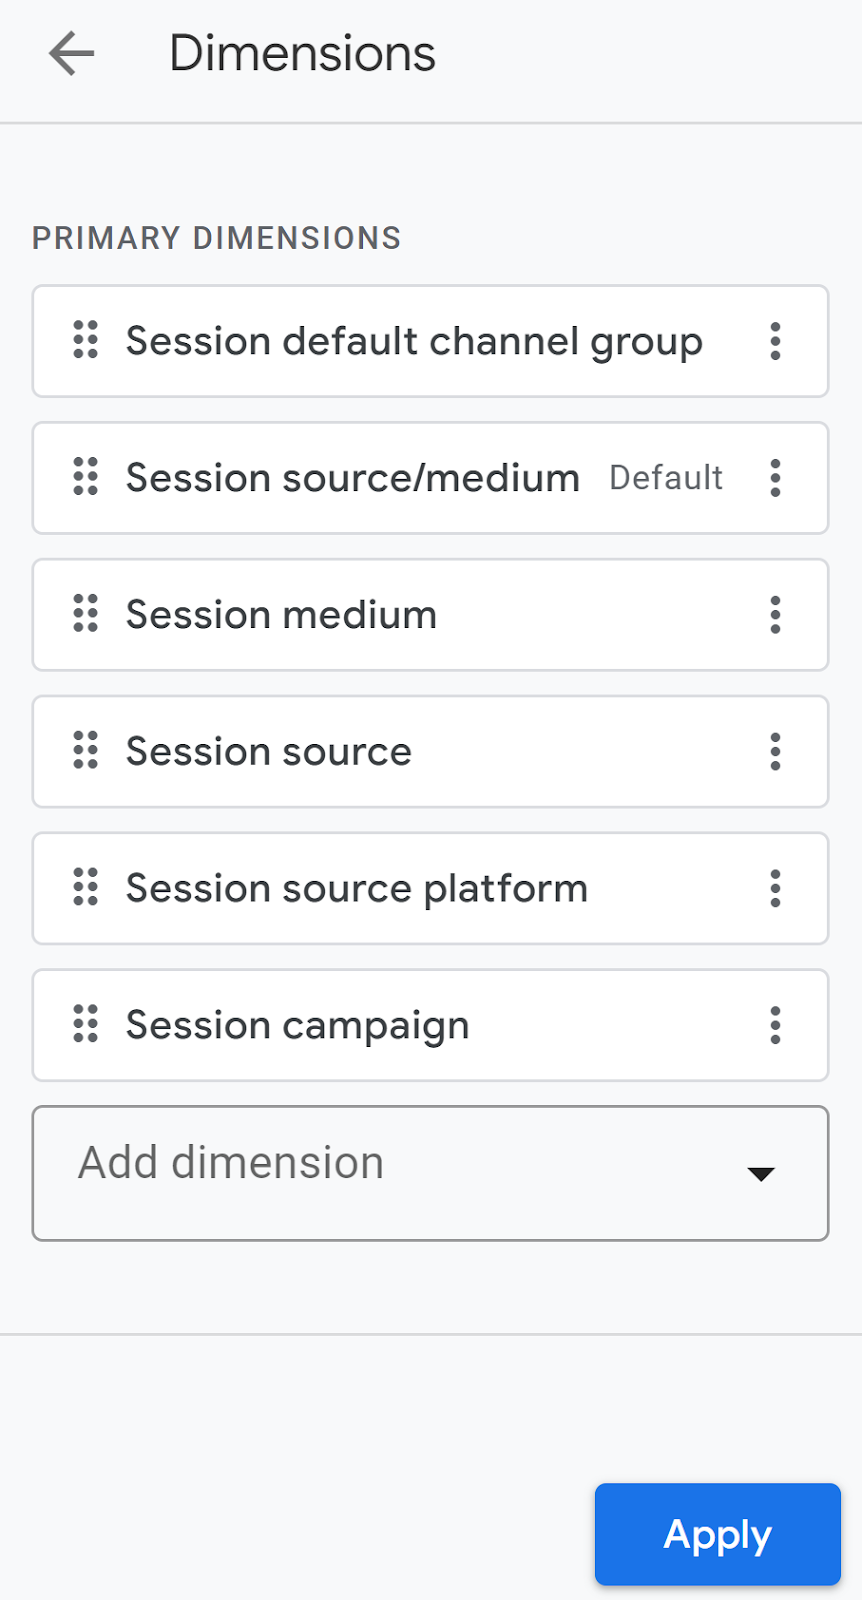
We can amend the primary dimensions that appear in the table by editing the ‘Dimensions’ section in the menu on the right. We can also edit the metrics and apply any filters via the same menu.
For now, let’s edit the dimensions to recreate the ‘Source / Medium’ report in UA. So, click into Dimensions and you should already see the dimension ‘Session source / medium’. Via the three dots next to this, set this as the default dimension and then click apply.
Now click save and name the report ‘Source / Medium’:

How to add reports to the menu
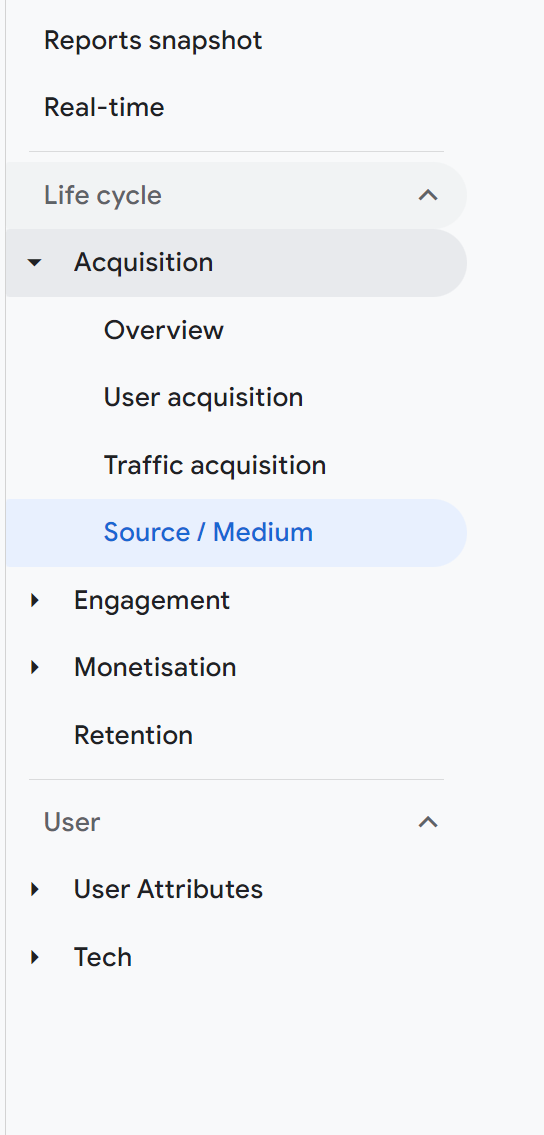
Going back to the Reports Library, edit the Life-Cycle collection and drag and drop the new ‘Source / Medium’ report in the Acquisition Topic.

Save the changes to the Collection and then view your new reports workspace.
Use cases
This awesome feature of GA4 means we can customise the interface to our specification. And for those that have got this far, yes – it is possible to change the GA4 UI to replicate UA. Believe me when I say, it is a dream!
Get in touch if you want to customise your own reporting library in GA4, or you can learn how to do it for yourself on our 6-week GA4 Immersion training course!
George Mendham

Subscribe to our newsletter:
Further reading
How to extract GA4’s event sequencing in BigQuery using the new batch fields
What is offline event data import in GA4?