Clearing 2026: why UK universities need recruitment intelligence
UK universities face a deficit crisis. Student Recruitment Intelligence can transform Clearing from chaos to precision.
Steven Elliott•6 Feb 2026

Being able to answer the question ‘which of my products do people regularly buy together’ with ease and simplicity can be invaluable. Market Basket Analysis, also known as association analysis, is a way of mining shopping data to establish a set of rules that describe purchasing patterns. This analysis can be conducted using a wide variety of software such as SAS, Python and R.
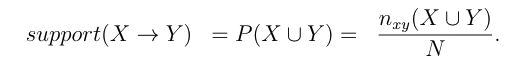
The reason for investigating association is to identify groups of products that are often bought together, implying that the products have a strong affinity. In MBA the product groups are shown by rules, for example one rule will say that, given bananas are in the basket there is a high probability that chicken breasts and spinach will also be in the basket. To interpret the significance of each rule there are three corresponding metrics; support, confidence, and lift. Support is the frequency of transaction in which all items are bought in the same basket. This is calculated by dividing the number of baskets containing all items by the total number of baskets. Let us take an example where we want to calculate the support for product X and Y, out of all transactions N, where the products appear together nxy times. This can be written as
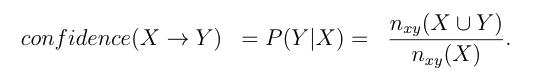
Confidence is the percentage of transactions that contain Y if and only if they contain X. This means that confidence is the conditional probability that the two items are bought together. It follows that
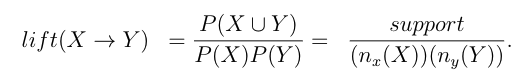
The final metric, lift, removes the effect of product frequency. This means that lift is best suited for ranking rules, opposed to interpreting the value. The higher the lift the more significant the rule.
The generated rules consist of a left hand side (LHS), right hand side (RHS), support, confidence and lift. The LHS shows product X, this is always a single product. RHS tells us that given product X product(s) Y are also in the basket. Visualisations are often the best way of analysing results, particularly when large numbers of rules are generated, they are also powerful when presenting your findings. The complexity and number of your rules will dictate your choice of visualisation.
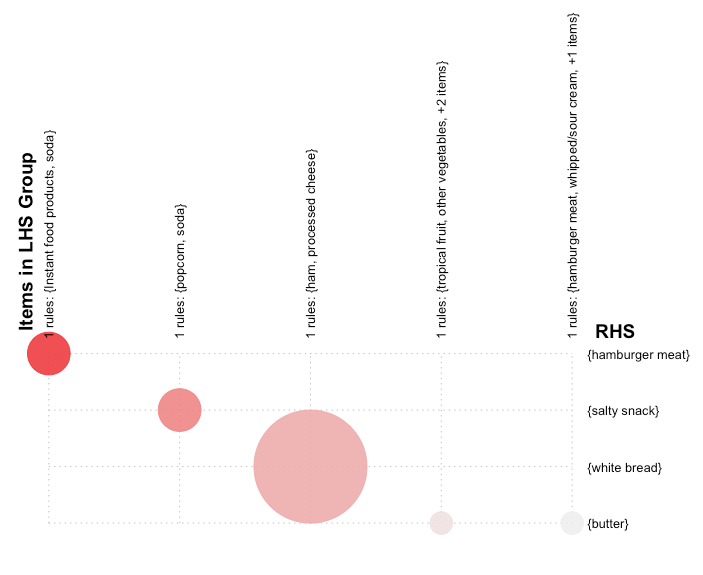
A grouped matrix (“Fig 1”.) gives an easy way to compare the support and lift of your top ten rules. Each rule is represented by a bubble at the intersection on the products involved in the rule. A large bubble shows that the products often appear in a basket together; darker bubbles have higher lift.The grouped matrix can become too busy when more than ten rules are visualised.
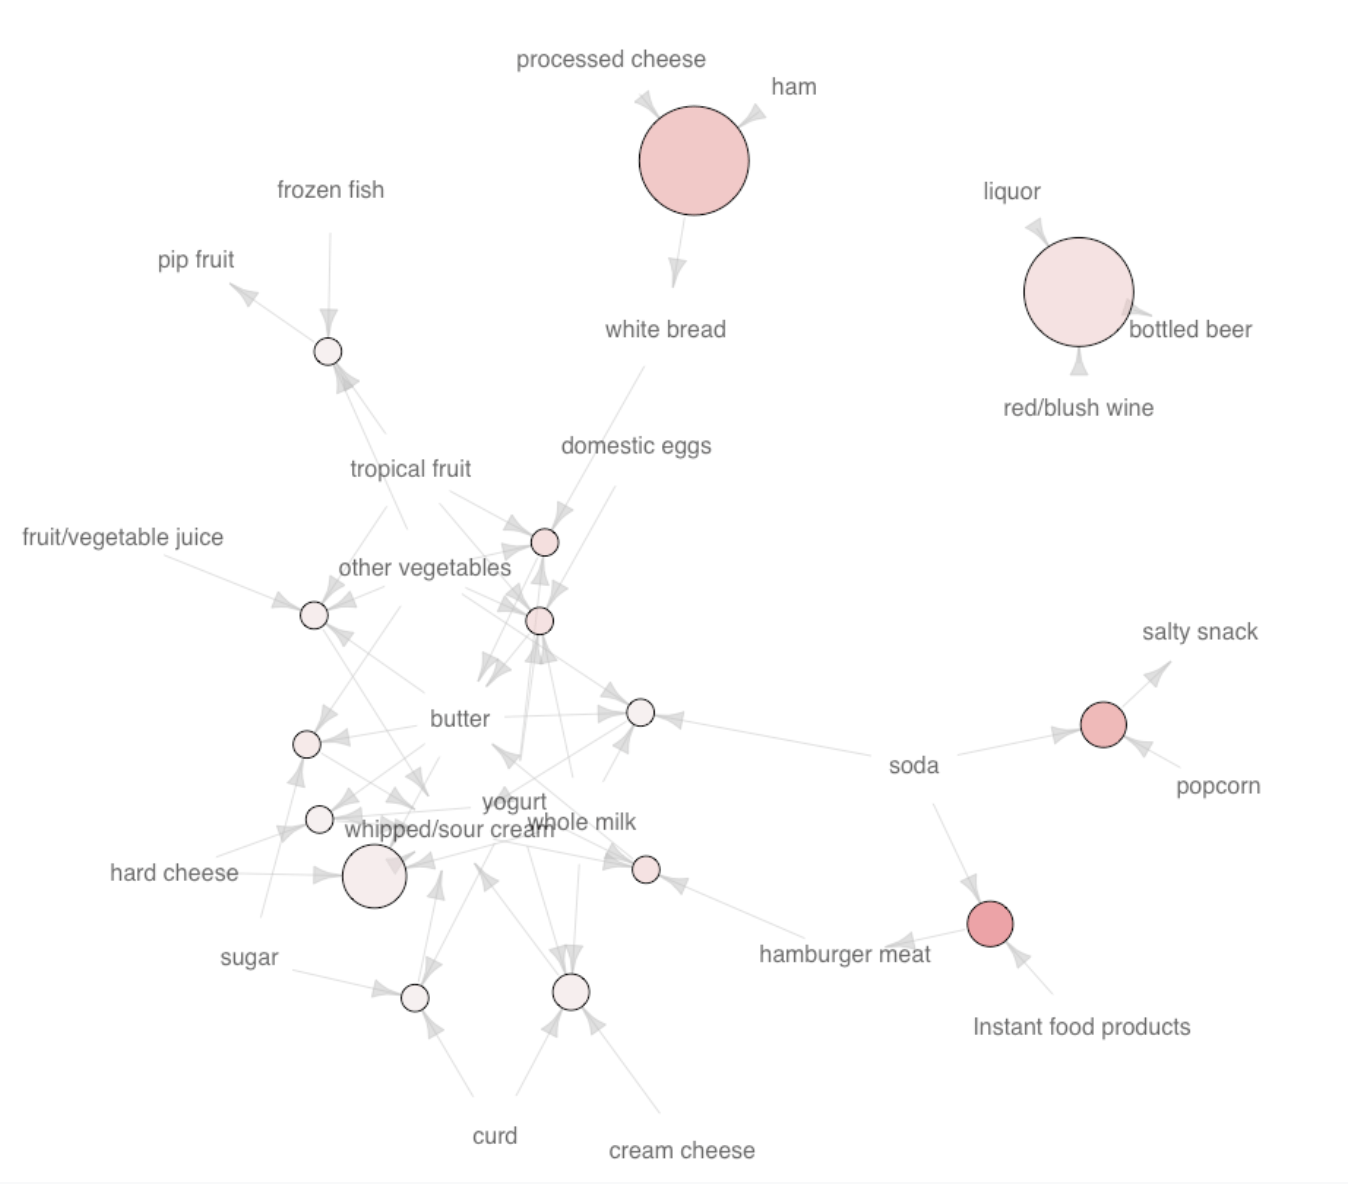
In such cases using a network graph (“Fig 2”.) is preferable. As with the previous visualisation size is representative of support and colour with lift. Here the arrows show rules going from LHS to RHS. Identifying groups of products is simpler using the graph below, as you can immediately see product clusters and interaction.
The power of Market Basket Analysis can be applied to fields outside of transactions analysis. It could be used with Google Analytics data to find pages that are often viewed in the same session or channel groupings that lead to a transaction. MBA can be used to mine any data for association rules, making it very flexible as well as easy to use. If you would like to find out more please feel free to contact us.
From GA4 implementation to server-side tagging and consent management — we'll make sure your data is accurate and complete.
References
Hahsler, M. and Chelluboina, S. (2011), ‘Visualizing association rules: Introduction to the r-extension package arulesviz’, R project modulepp. 223–238.
Hahsler, M., Grun, B., Kepler, J., Hornik, K. and Buchta, C. (2005),Introduction to arules.URL:https://cran.r-project.org/web/packages/arules/vignettes/arules.pdf
R Code for Running MBA
install.packages('arules')
install.packages('arulesViz')
library(arules)
library(arulesViz)
data(Groceries)
txn_rules<-apriori(Groceries, parameter=list(supp=0.001, conf=0.6, target="rules"))
rules_sorted<-sort(txn_rules, by="lift")
subrules <- head(rules_sorted, 5)
plot(subrules, method="grouped", interactive=FALSE)
plot(subrules, method="graph")
From GA4 implementation to server-side tagging and consent management — we'll make sure your data is accurate and complete.
Our instant analytics audit scans your GA4 configuration and flags what's missing, broken or misconfigured.
UK universities face a deficit crisis. Student Recruitment Intelligence can transform Clearing from chaos to precision.
AI expert Daniel Hulme, founder of Satalia, shares his journey from UCL PhD to entrepreneur, discussing AI, consciousness & deep tech.
Dara and Matthew chat with Juliana Jackson on her journey, product mindset, and how AI is shaping modern analytics.