How data moves between Google Analytics 4, BigQuery and Data Studio
Over the last year or so I have been getting myself familiar with Google Analytics 4 (GA4 – previously App+Web), especially since it came out of beta back in October 2020 and became the default property type overnight. To be honest, this was a crash course as up to this point I had very little to do with Firebase, or app analytics in general!
The more time I have spent setting up GA4 on websites and apps, the more I have come to appreciate how different it truly is from Universal Analytics (UA or GA3). I know this sounds obvious, but the messaging from Google has been one that alludes to it being a natural and simple process to get it dual tracking alongside UA. In their defence, it is rather easy to get the code on the sites and apps, especially as there are a number of automatically collected and Enhanced Measurement events that don’t require any additional tagging to work!
For me however, one of the big nice-to-have features in GA4 is the Google BigQuery (BQ) connection for the raw event-level data daily and stream exports. But then I quite quickly came to a crossroads when it came to building some dashboards in Google Data Studio (GDS) – do I use the native GDS-GA4 connector through the Data API, or use the native GDS-BQ connector? At the surface-level, it probably doesn’t matter either way assuming you have the SQL skills-to-pay-the-bills. However, there are some dimensions that are not available in the BQ export/stream that are in the API such as Age and Gender and some metrics that are just easier to have pre-calculated such as ARPU, Engaged Sessions, etc.
My prediction over the coming year(s) is that the data available in the GA4 Data API will diverge from the data fed into BQ, mainly due to data privacy and sharing policies. For example, data from Google Signals is used in GA4 to identify users across browsers and devices as well as providing demographic data. This is not exported to BQ as it is all anonymised and aggregated (to us) behind the scenes. Google isn’t about to share their secret ad profiling recipe as easily as this – especially as ad revenue is 70+% of their total!
Anyway (tangent over), to make better sense of this I have made a few attempts to draw out how all the data feeds work all centred around GA4 (of course).
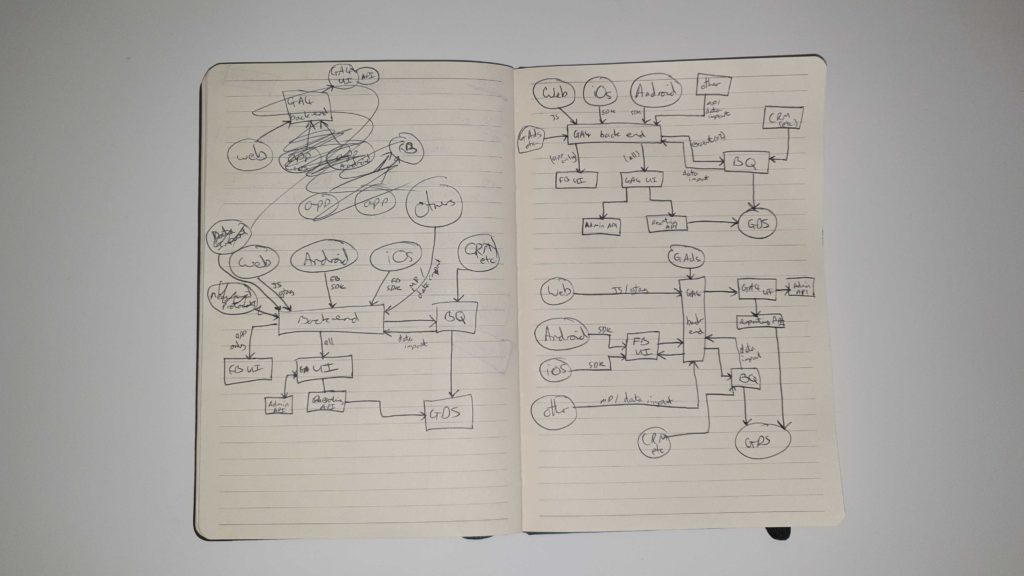
A few pages later, I felt I had a good enough grasp to move it to a Google Drawing (ignore the random choices for shapes and colours, I just went with whatever!):
As you may be able to tell, it was a bit more complicated than I naively first thought. As I drew each component it was apparent that I needed to consider all data feeds and transfers that I could possibly think of.
I’m by no means suggesting that this is technically correct behind the scenes, I’m sure there’s loads I don’t know and am ignorant to – however it’s a ‘v1.0’ and helps my colleagues and I get a better feel for how all the data flows, pipes, lakes and oceans start to come together.
Please get in touch if you spot anything I have missed out, misrepresented or want to suggest updates – it would be great to keep this as up to date as possible. My email is daniel@measurelab.co.uk, or you can use our contact us form.
We’ve recently designed a GA4 training course for teams that want to kickstart their use of the new tool. Get in touch if you want to book in and get a head start!
Daniel Perry-Reed

Subscribe to our newsletter:
Further reading

Easy ways to prepare your BigQuery warehouse for AI

Dataform for BigQuery: A basic end-to-end guide