Insights

Data Analysis

Data analysis techniques, statistical methods, and analytical insights (135 posts)

Browse the archive

135 results · Page 8 of 8

Toot toot... All aboard the Measurelab train!

In the last couple of months we've had three new starters and I'd like to give them a little nod of recognition, if I may. First up is (Doctor) Dave, who joined us as a Data Scientist in the Summer; he popped along to one of our Brighton Analytics meetups and it just went from there. Dave's background is in terribly clever machine vision stuff - he was recently working in Barcelona (at Universitat Pompeu Fabra) doing Postdoctoral Research involving adaptive image processing algorithms (wher

Mark Rochefort-

Firebase Analytics demystified

<span style="font-weight: 400;">After a steep learning curve into the world of Firebase Analytics or Google Analytics for Firebase, it seems that a blog post about it would be much valued and appreciated. I’ve compiled a list of the most frequently asked questions.</span> 1. How does Firebase Analytics define a session? Firebase Analytics defines a session as a user engaging with your app for a minimum amount of time (10 seconds by default) followed by your user not engaging with your app

Alex Cirstea-

The Problem With Google Tag Manager Triggers: Those Shiny New Built-In Options (And a Possible Solution)

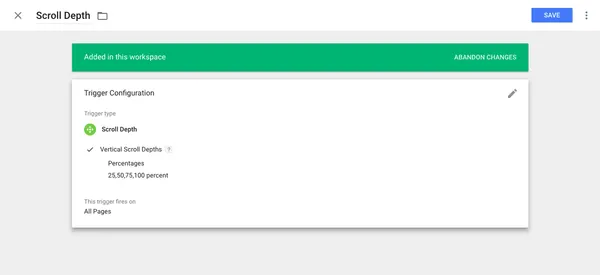
Hey folks. The shiny new Built-In Triggers for things we used to have to use big old Custom HTML tags to track before—Youtube tracking! Scroll depth! Element visibility!—have had a bit of time to bed in now. We had a look at changing over to the new built-in solutions everywhere we were using Custom HTML—if it's being done by Tag Manager itself, it has to be better, right? Right? Wrong. This issue is related to a fact that I've discovered through experience but not seen actually documented exc

Adam Englebright-

When GA just isn't enough - my #measurefest talk

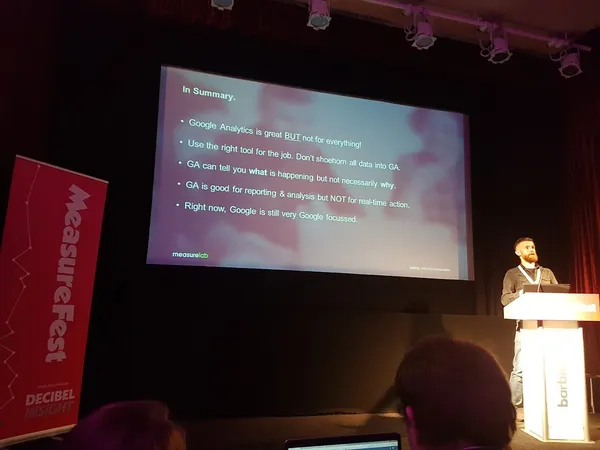
<span style="font-weight: 400;">I spoke at <a href="http://www.measurefest.com/" target="_blank" rel="noopener noreferrer">#Measurefest</a> in the Barbican last Friday. Here are the slides from my talk but I wanted to write a quick summary to give a bit more context as the slides on their own don’t tell the story. </span> When GA just isn't enough from darafitzgerald The title of the talk was "When GA just isn't enough". For some that know me this might sound like an unexpected title. I sp

Dara Fitzgerald-

Data Visualisation with Power BI

Since the recent(ish) announcement of <a href="https://www.google.co.uk/analytics/360-suite/data-studio/" target="_blank" rel="noopener noreferrer">Google Data Studio 360</a>&nbsp;(Google's answer to&nbsp;Tableau), we wanted&nbsp;to&nbsp;see where Data Studio 360 will fit into the mix by trying to compare what little we currently know about it with&nbsp;other data visualisation tools that are already on the market. Fast forward a few weeks, and to cut a long story short, Microsoft Power BI

Daniel Perry-Reed-

R for analytics beginners: part 4 – building graphs and analysing data

Earlier in this series we reviewed several R libraries for Google Analytics. Then we started using RGA. Next we pulled data from Google Analytics using RGA. What now? I’m reaching for my university notes, because we’re getting into proper R territory. Diving into graphs with R Let’s start with graphs! Who doesn’t love a good graph? It just so happens there’s a lovely R library called ggplot2 that does really excellent graphs of all shapes and sizes1. We’re probably best looking at a few speci

Adam Englebright-

R for analytics beginners: part 1 – getting started

Two years ago, or thereabouts: I was introduced in my statistics lectures to a programming language and software environment called R. I took to it immediately, preferring it by far to the simpler software we’d used before, and also to the proprietary software (SAS, SPSS) we used in addition. Flash forward to: A couple of months ago, sitting in the audience for the talks at MeasureFest, and then we had what was, I think, by broad agreement, the best talk by Ela Osterberger, about using R with

Adam Englebright-

How to use the Google Analytics Embed API: guide & examples

When I started at Measurelab, way back in July, one of the items on my List Of Things To Do was to look into new and exciting ways of visualising data for clients. A few weeks ago I spent some time experimenting with dc.js but then, Mark and Dara went to MeasureCamp in London (I was going to go but I had other commitments) and came back bearing glad tidings of great joy for all analytics consultants, because unto Google, in the town of Mountain View, was born an API, and the angel Justin C

Adam Englebright-

GA Summit 2013: Key Google Analytics updates & insights

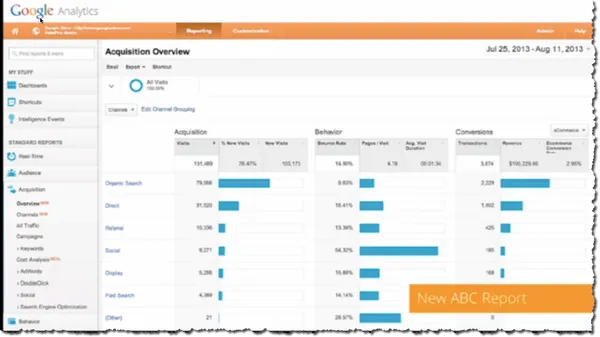
The theme of this years summit is a focus on helping customers in three areas: Access, Empower, Act. The slide above was shown by the GA team to summarise the 3 part theme. Babak Pahlavan (Director of Product Management, Google Analytics) let the crowd know that GA have made 70+ releases in 2013 so far, which makes sense on reflection given how busy the year has been. This has included major updates such as the global roll out of Universal Analytics, the introduction of the Attribution Modellin

Dara Fitzgerald-